Remarkable Research Results!
Below is an excerpt of page 1 (the cover sheet of) some of my past research initially discovered many years ago, which I like to update annually. I believe it is of significance because the market’s returns between October 22 through February 19th the following year tends to actually beat the historical averages compared to e.g. investors who buy and hold throughout the whole year. The results for the past 15 years are displayed below, under the research abstract.
In the tables below I have posted an update of the past 15 years of data, and I have calculated the index returns over October 22 through February 19 for each index for each year. At the bottom I have calculated the arithmetic average returns, the median returns, and the standard deviation of the returns, as well as the probability of success (“Success Frequency”). I also bolded the best index performance for each year to assist you in your data analysis of my research results. Notice the S&PMidCap400 achieved the best results (displayed in bold figures) in 6 out of the 15 years of data presented, while also having the highest average return over the back tested interval. I have also graphed and posted below the indices performance over the past period of interest, being October 22, 2014 to February 19, 2015. Lastly, when October 22nd or February 19th fell on a weekend, the interval was shortened to the nearest trading day.
What I like to do in my investment portfolio is amplify this research discovery and its back tested discovery, being the time interval of October 22 through February 19th (of the following year) using index options. Index options can achieve e.g. five times (or more) the performance of the market’s return, from the initiated point, through the sale, by using a level II index options purchase of deep in the money calls. This is not something you’d want to do with 100% of your portfolio, but everyone can swim at their own risk.
Achieving five times the performance of e.g. the S&P MidCap 400’s return initiated on October 22, 2014 through February 19, 2015, using ETF options, would have e.g. returned (5 x +11.32% or) +56.60% over that time interval, for however much you had allocated to it. That’s pretty awesome if you ask me.
THE RESULTS SPEAK FOR THEMSELVES!
Enjoy!
Andrew G. Bernhardt
Bernhardt Capital Management, L.L.C.
Market Equity Research
© 2015, All Rights Reserved.
ANDREW GASTON BERNHARDT
Founder and President
Web: http://www.BernhardtCapitalManagement.wordpress.com
E-Mail: BernhardtCapitalManagement@yahoo.com
ABSTRACT
The fourth quarter’s market rise phenomenon is something that I have always kept an eye on, out of personal curiosity, some name callers deem it “garbatrage,” and/or some even as “ghosting.” There seems to me to be a strong correlation noteworthy of significance between strong fourth quarter earnings, and increases in the price of stocks and indices. Within this research I successfully determined a time interval where the overall indices seemed to rise, either strongly, mildly, or lightly, consistently and categorically throughout the history of the markets and their respective indices. I originally thought that the November 1st through mid January time interval would be best. However after taking a closer look at all the daily data since 1950 for the DJIA, and all the data for the Nasdaq Composite since its inception, past data of the S&P 500, Russell 2000, S&P MidCap 400, and the Wilshire 5000 I discovered that on or about October 22,nd (at the NYSE closing bell) the markets tend to reach a bottom on an annual basis, while they usually rise until the last trading day of the year. I discovered that October 22nd was the overall point of inflection, the market’s bottom. Later I discovered this rally extended through January, and for the Nasdaq Composite and the S&P MidCap 400 that this rally extends until about February 19th with high success rates (spanning many years into the past). Success is defined as the probability of a rising market during the specified time interval; therefore the failure rate would be the probability of a falling market during the specified time interval. Furthermore, lengthening the time interval until mid February actually increased the probability of failure for the Dow Jones Industrial Average (DJIA), but dramatically increased the probability of success for the Nasdaq Composite, while also increasing the success rate for the S&P500. Additionally, it should be noted that the failure years occur less frequently between Oct 22nd through Feb 19th, and are less severe, compared to an investor who “buys and holds” for the long term. I believe that this is of significance because any investor can match the broader indices’ performance with the use of index Exchange Traded Funds (ETFs), primarily ticker symbols DIA, ONEQ, SPY, IWM, MDY, and VTI. With the use of CBOE- index-options or ETF-options, this performance can be enhanced two to five fold, even at just level two “purchases” options trading (without the use of margin as leverage). Corporate loans and the use of bull call debit spreads (and/or bull call ratio back spreads) can also enhance performance further, where performance is the rate of return realized. More sophisticated investors may prefer to employ the use of various kinds of credit spreads in an effort to “pocket” the time decay. I believe that the major indices rise so strongly, as my research indicates (see sheet 3), between the October 22nd through February 19th (open Oct 22nd at closing bell, close Feb 19th at closing bell) time interval because of increases in consumer spending (primarily holiday and travel expenditures), seasonally strong fourth quarter earnings of major corporations that make up the indices, new government spending proposals, mutual fund “window dressing” (where fund managers attempt to buy the years best performers, primarily the stocks that make up the indices), the “Santa Claus Rally,” the “January Effect,” 401K and IRA contributions, end of the year tax loss selling abatement, and the fact that the Congress is adjourned. The Dow Jones Industrial Average performance of success in the shorter time interval as uncovered is also of significance, although it lags the stellar Nasdaq’s performance in the longer time interval. S&P 500’s data tended to outperform the DJIA’s data, while the S&P MidCap 400 tended to be the most consistent. All of this can be easily presented in table form, which is exhibited in the following pages, with some concise captions, and an explanation following the data pages. Please understand that options carry risk and uncertainty, can be extremely volatile and sensitive, and are not suitable for all investors. Practical applications of options could include initiating a 33% allocation to 3:1 enhancement of stock indices using long term index-call-options, and 66% Emerging Market Government (Sovereign) Debt Obligations within a portfolio (matched by e.g. the ETF tickers EMB and/or PCY). I call this the “1/3rd & 2/3rds strategy.” This particular allocation would beat the index you desire to use as your benchmark. Portfolios exposed to the 33% 3:1 enhancement index calls effectively make this hypothetical portfolio match the performance of the chosen index, and the 66% in debt obligations, means you’re earning income, which leads to a “foolproof, water tight, slam dunk, calculated method” of outperforming the index over the long run.
![[2-22-15] Backtesting Oct. 22 to Feb. 19, 2000-2015](https://bernhardtcapitalmanagement.wordpress.com/wp-content/uploads/2015/02/2-22-15-backtesting-oct-22-to-feb-19-2000-2015.png)
The results above I believe, speak for themselves.
These back tested results taken back further into the past, are stunning.
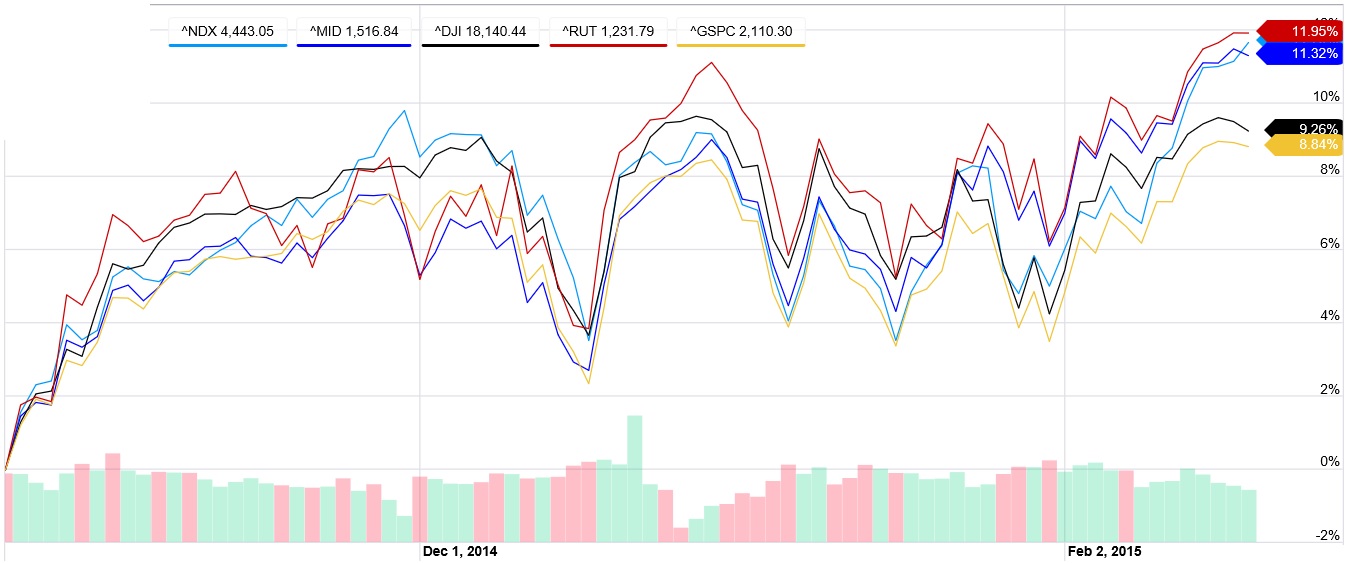
Here’s the most recent back tested period of interest, displayed above, October 22, 2014 through February 19, 2015.
Andrew G. Bernhardt
© 2015, All Rights Reserved.
