11:30pmCT, Friday, January 23, 2015 “On the Day After the EU & ECB’s QE… POSTRIDIE EIUS”
“POSTRIDIE EIUS”
“THE DAY AFTER”
On Friday, on the day after the EU & ECB’s QE, (when Mario Draghi’s ECB made a rate decision to leave rates unchanged, and to offer Quantitative Easing of nearly 60 billion Euro per month (until at least Sept of 2016, and also until at least 2% inflation)), U.S. major stock indices sold off slightly, but finished up strongly for the week. On Friday, the VIX rose +1.59% to 16.66. The DJIA sold off, -141.38 points or -0.79% to 17,672.60. The S&P500 fell -11.33 or -0.53%. The S&PMidCap400 declined -6.50 points or -0.44% to 1,455.79. Equities slumped, generally speaking, mostly during the final two hours and ten minutes of trading, when the DJIA shed about 120 points of its 141 point decline.
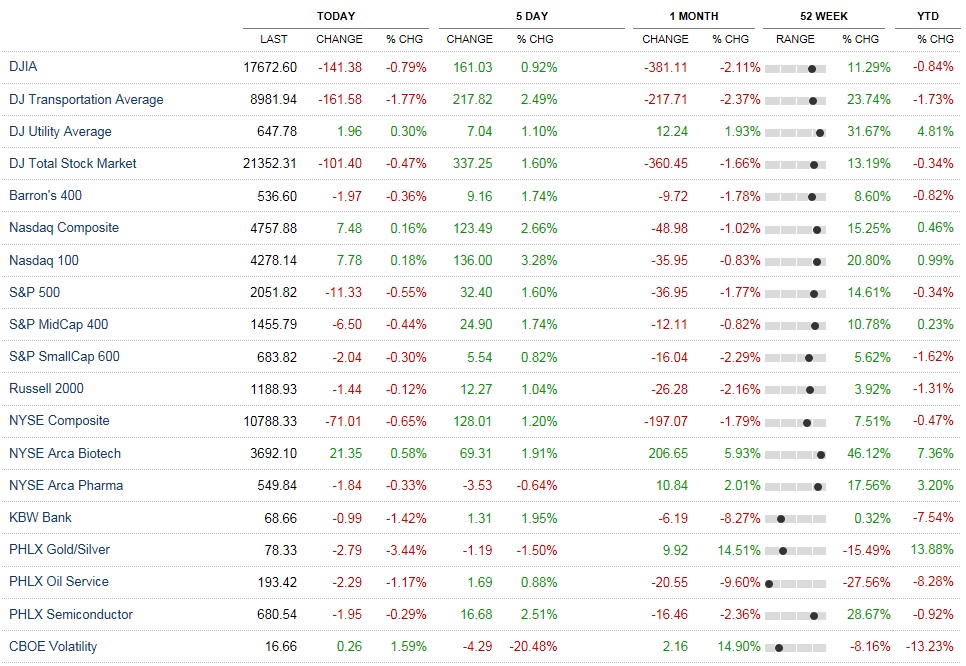
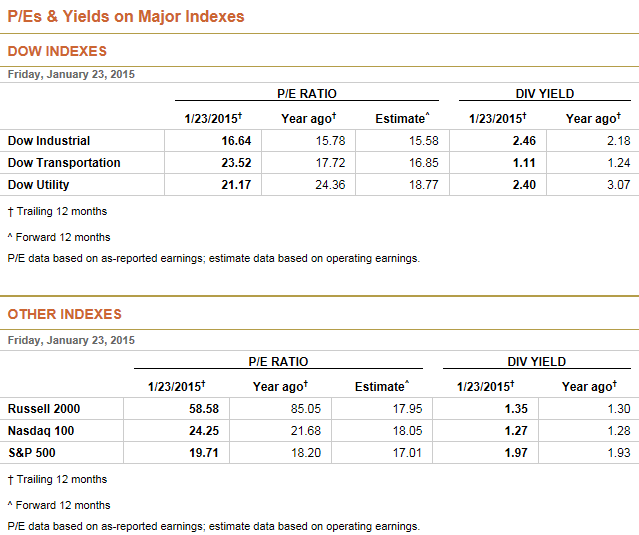
Note how the 10 year T-Note yield is now 1.79%, while the S&P500’s dividend yield is 1.97%, and the DJIA’s dividend yield is now 2.46%. This (these stock indices yields greater than the 10 year T-Note) is very very bullish for equities going forward a year, based on long term past performance.
In fixed income, Treasuries rose today, as measured by ticker AGG, which closed up +0.28 or +0.25% to 111.71. The etf ZROZ closed up +1.68% or 2.20 to 132.83. Ticker TIP closed up +0.61% or 0.69, closing at 114.32. IEF was up +0.65% or 0.71 points to 109.24. Today the 10 year T-Note yield closed at a yield of 1.79%, the 30 Year T-Bond yield closed at 2.37%. The high yield sectors of fixed income also rose today. Here’s how the high yield fixed income etfs did for today. EMB rose +1.18% to 111.65, PCY rose +1.42% to 28.66, HYG was unchanged closing at 90.01, JNK rose +0.03% to 38.84, and QLTC declined -0.64% or -0.3096 to 48.3904.
The Euro closed down Friday, losing -1.39% to end at 1.1207 versus the U.S. Dollar, a year ago it was at approximately 1.36; Five years ago approximately 1.42.
QE is designed to depreciate the currency practicing it, in an effort to raise exports on an exchange rate basis, to make your own exports cheaper for foreigners. I suppose printing your own money (if you’re a central bank) and then simultaneously purchasing your own debt (your own bonds, notes, and bills) is analogous to a corporation who prints its own common stock (in a secondary offering), and then retires its debt, but purchasing its fixed income previously issued (or currently being issued) back. It’s good to eliminate debt. This helps to stimulate the economy. Printing money to purchase your own bonds, if you’re the government, also helps to mitigate the effect of crowding out investment and crowding out borrowing, since the cash isn’t being soaked up by investors, but is instead printed by the Central Bank. When a government buys its own bonds, it then owes itself money, and earns interest (which it also owes to itself… kind of like your left hand, owing your right hand money!); This is similar to retiring the debt, and it also helps to reduce interest rates. However, we already see interest rates in the Euro Zone at nearly zero, and literally also already into negative territory. Perhaps, someday, people will realize they want to earn interest themselves, rather than pay a central bank while holding and owning fixed income. Negative rates don’t really seem conducive to savings. Even rates at zero a phony to me. Who would lend money to anyone at zero? They’d be ripping themselves off! Who would lend money at negative rates? That’s really ripping yourself off! It’s lunacy to me.
Hell, if I could, I’d borrow money at 0.00%, or any negative rate you’d like! Perhaps I’d buy some Treasury securities with that free money lent to me at zero, or with the money you gave me, plus the money you’d owe me later, if I “borrowed” it at negative rates. What a good one! I wish I could borrow myself this way well into the trillions of dollars. Wouldn’t you?
Oil traded down today, closing -1.55% or -0.72 to $45.59 per barrel.
Notable EPS releases that are up and coming soon, include XOM on February 2nd (before the market opens). CVX reports on Friday, January 30th (before the market opens); and BP on Tuesday, February 3rd (before the market opens). MSFT reports on Monday, January 26th (after the close). AAPL reports on Tuesday, January 27th (after the close), surely there will be a lot of HYPE(!!!) surrounding that EPS report. AMZN reports on Thursday, January 29th (after the market close). QCOM reports Wednesday, January 28th (after the market close).
On the Economic Release Calendar of events for next week, I believe the potential market moving events include Monday’s Dallas Fed Manufacturing Survey at 10:30amET. Tuesday’s S&P Case/Shiller HPI at 9amET. Wednesday’s EIA’s Petroleum Status Report at 10:30amET. Thursday’s notable releases will include Jobless Claims at 8:30amET, and Pending Home Sales Index at 10:00amET. Friday’s reports will include GDP as well as the Unemployment Cost Index both at 8:30amET, and the Chicago PMI at 9:45amET, and finally Consumer Sentiment at 10:00amET.
If I had to take a guess, I’d say (this is what my “crystal ball” is telling me) that next week will be relative quiet, until the Economic Calendar of events on Thursday and Friday rock the boat a little bit. I’d like to think the reports will bring a rally to higher stock prices. I’d also suggest that AAPL stock will likely increase after its EPS release, it nearly always does post its earnings reports, but this is just an observation I’ve made over the years, obviously past performance isn’t indicative of future performance (and four letter ticker symbols are like four letter words to me sometimes… on the that note the Nasdaq has traded down over the past nearly 15 years). I’d also suggest that oil will continue to trade in a wide range, with wild and violent swings to the upside and downside, nearly every day, and I believe that an at-the-money straddle could potentially be very lucrative on ticker USO, choosing expiration dates going out about two weeks. Ticker HAL and its EPS report of last week proved to be received very well by investors, this bodes well for the energy sector going forward. I’d also like to note that XOM, CVX, and BP have literally beat their EPS reports over the past two to three quarters, despite the extreme sell off in the price of light sweet crude oil since June of 2014. However, despite them beating their EPS consensus estimates, shares have obviously declined substantially since June of 2014 all across the energy sector (this is readily apparent in the share price of etf XLE). Swim at your own risk! Perhaps, a married put aka a protective put trade would be lucrative for energy stock investors, or investors in ticker USO. I’d be tempted to purchase puts in-they-money, going out at least 3 to 6 months, combined with the stock purchase, for construction of the hypothetical protective put trade. The energy sector’s stocks, and oil is so wildly volatile, sometimes I think I wouldn’t touch the sector with a ten foot pole! I believe, once energy prices stabilize and begin to ascend though, there’s going to be some major opportunities in the energy sector, and in the high yield fixed income markets.
Well that’s about all the news that’s fit to print.
By Andrew G. Bernhardt

