May 25, 2015 – “Stock & Bond Market Checkup”

May 25, 2015

Stock & Fixed Income Market Checkup

5-25-15 Major U.S. Indices

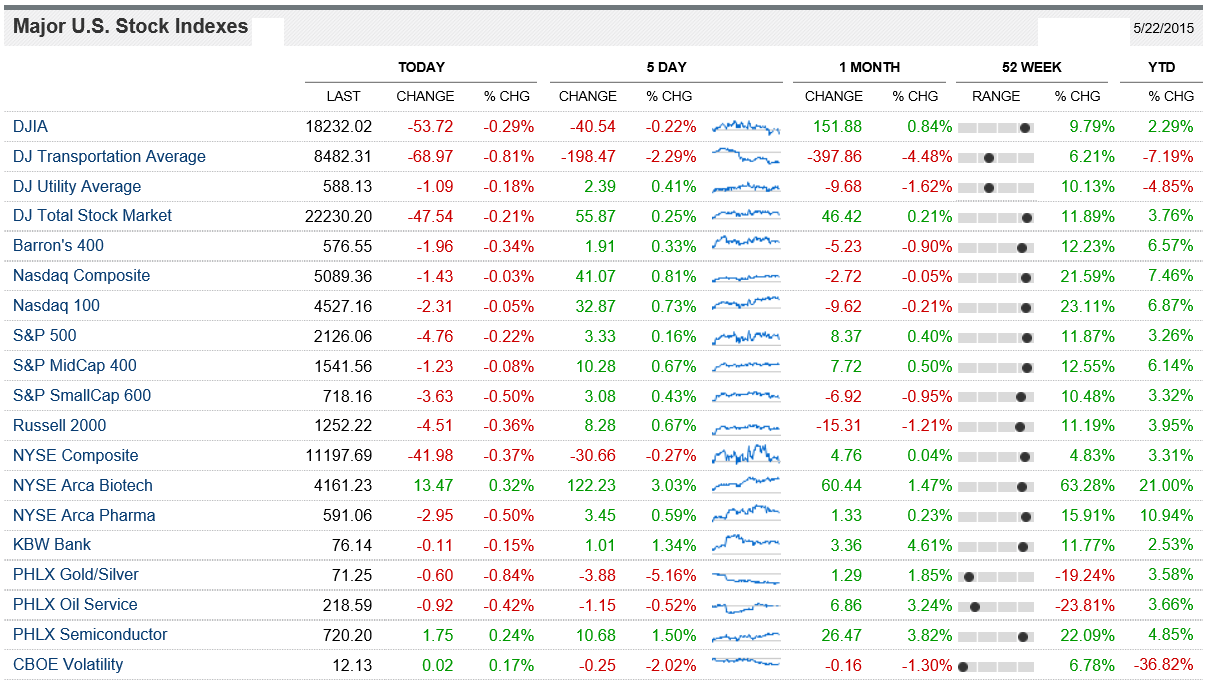
As you can see the markets have done fairly well YTD.  The S&PMidCap400 has returned +6.14% YTD, the S&P500 has returned +3.26% YTD, the DJIA has returned +2.29% YTD, Russell 2000 has retuned +3.95% YTD, and the Nasdaq 100 has returned +6.87% YTD.  Biotech is up roughly +21% YTD.  Know also that YTD the VIX has declined about -36.82%.  For a great assessment of the U.S. Economy (and the worldwide economy) press here, for the latest edition of The Economic Indicators, the April 2015 edition.

Some are voicing concern over the Dow Jones Transportation index, which is -7.19% YTD, however, if you go back more than YTD, say 1, 2, 3, or 5 years on a chart of the Transports against the DJIA, the Transports are outperforming; So to me there’s not much to be concerned about regarding that divergence YTD of Transports vs. the DJIA.

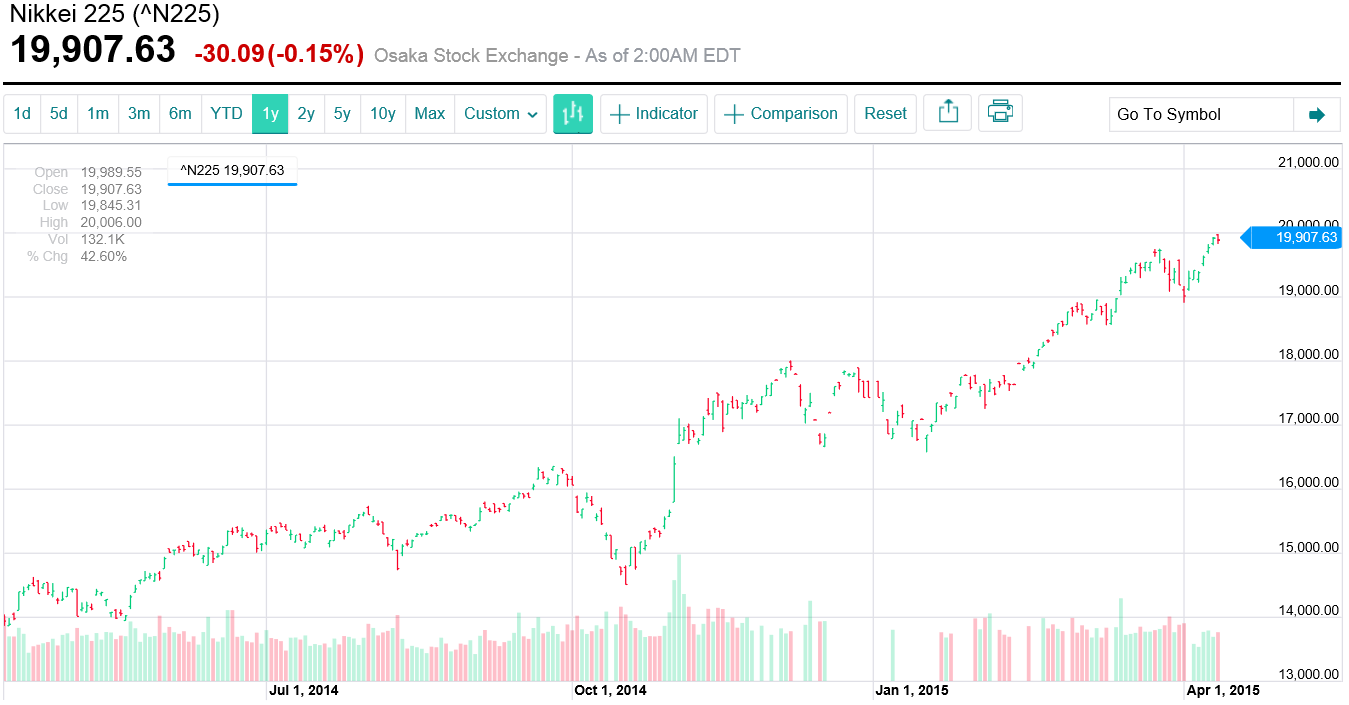
I’m currently rooting for the DJIA, matched by the ETF ticker DIA, as it has the lowest PE Multiple of all the Major U.S. Stock indices, and also the highest dividend yield relative to all other major U.S. Stock indices (with the exception of Utilities).  The DJIA has also lagged the other major market indices YTD, and I think it will eventually catch up.  I’d wait for a pullback before getting too aggressive with the indices here.  I think the DJIA will close around 20,000 near year end, as Jeremy Siegel has speculated publically, even if we get a mini correction soon, or a full blown ten percent (or more) correction.

I’ve annualized the DJIA since about March of 1999 to the present, about 16.25 years ago (when it was at 10,000) it annualizes to +3.77%. This is well below the historical norms of roughly +7.50%.  What has hindered the equity markets over the past 15 years or so has been the Roaring 90s, which set us up for the Tech Bubble of the year 2000 (the Nasdaq peaked at 5,132 on March 10, 2000- It still hasn’t reached break even with that figure from over fifteen years ago!), and what I describe as “The Greater Depression” of late 2007 to roughly early 2009.  The S&P500’s performance over the past 16.25 years has been weaker than the DJIA due to its technology exposure (tech has been the biggest disappointment over the past 16.25 years…  “Tech” is a four letter word!).  The best equity performance over the long run can be found in the S&PMidCap400, which has had significantly more consistent and stronger earnings growth, and better annualized returns versus all other major U.S. market indices (see ETF ticker MDY).

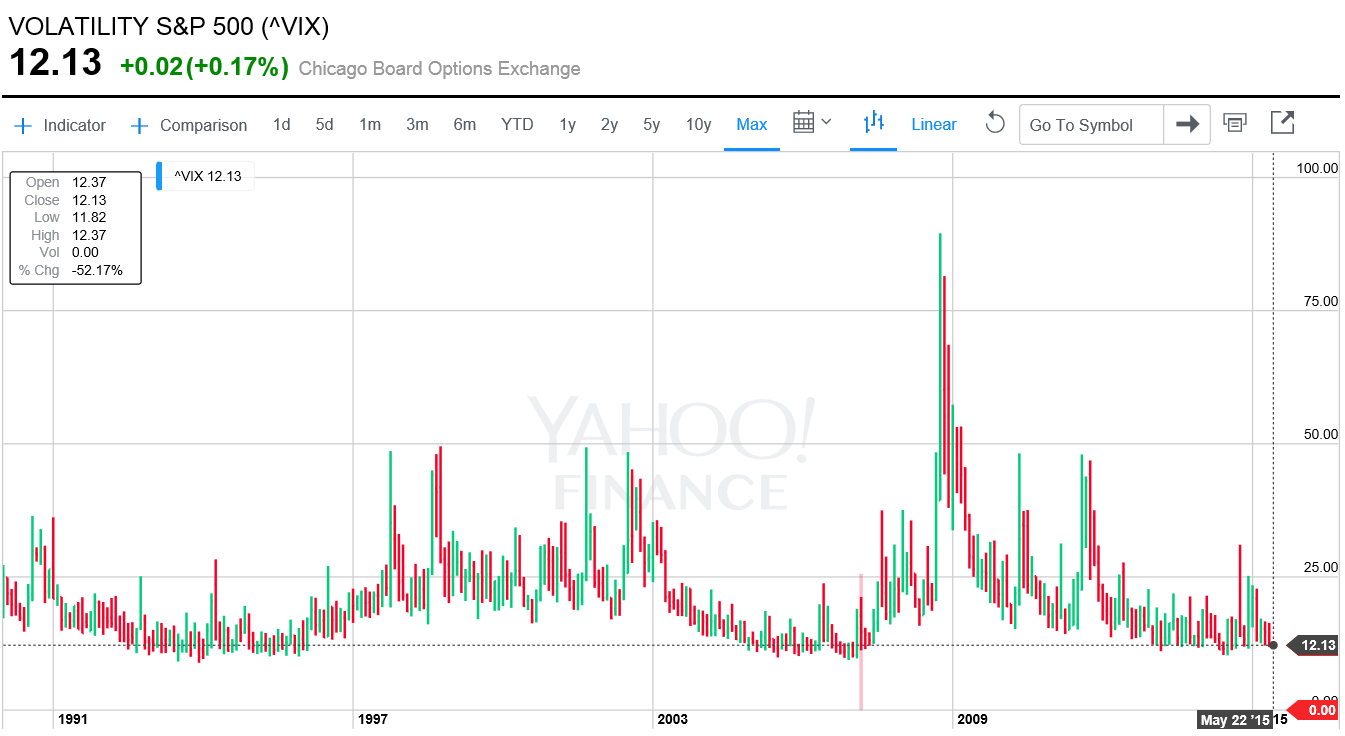
In my view currently the VIX has gotten very very low, and should be indicating that you should be cautious going forward.  Low VIX indicates euphoria and mania in the equity securities markets.  There’s only been a handful of days where the VIX has been so low, for very long, and when it spikes, or increases, the equity markets can come tumbling down fast.  This brings opportunity.

There’s an inverse correlation noteworthy of significance between the trajectory of the VIX, and the trajectory of every major stock market that there is, so when the VIX declines, the markets rise; and when the VIX ascends, the markets fall.  I think since it’s so very low right now, it will likely increase, and the markets will decline.

5-22-15 Historical VIX Chart

My crystal ball tells me that we’re in for a mini-correction, of 3 to 5 percent before the markets will begin their ascent to new highs again.  I’d remain cautious (holding cash) until we get a pull back in stock prices.

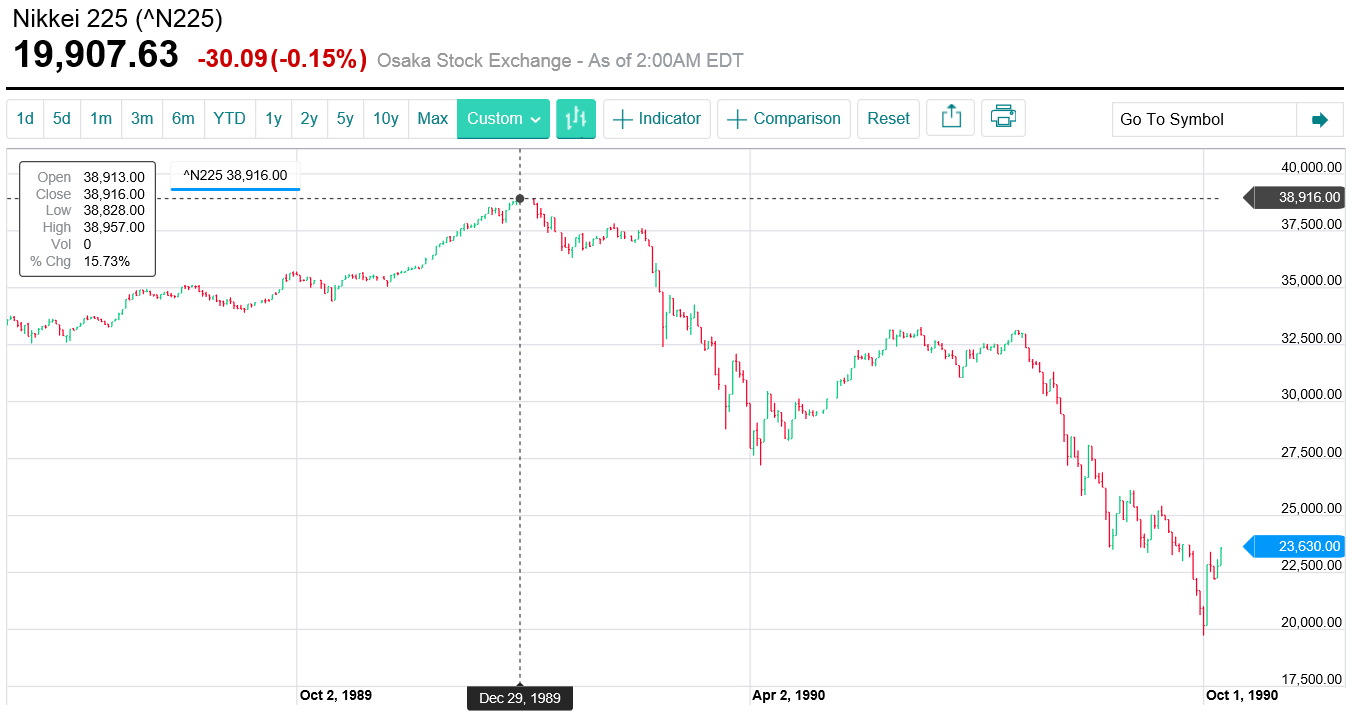
The main concerns going forward, are a low VIX; markets are at nearly all time highs; Greece is totally insolvent and may exit the Euro currency and the EU; and economic data has been weak in the USA and elsewhere;  If and when Greece exits, investors will worry about Italy, Spain, and Portugal exiting the Euro currency and EU itself.  Additionally, China is slowing (despite its recent booming stock market), Europe isn’t really that strong (and the European stock and fixed income markets may be in bubble territory, as is the case for the Euro currency itself); Russia is really hurting due to low oil prices; and Africa is fundamentally totally speculation (and is classified as a “frontier market;” There may be HUGE opportunities there in the future over the long run), and Central and South America are in a slump (Brazil has been very weak for many years now).  Japan has also been weak, despite its stock market ascending.  This tells me the backdrop for the economy worldwide is not really improving that greatly.  PE Multiples are neither low, nor high, but they’re definitely closer to high, than low.  Fear and market psychology over Greece’s insolvency could push the equity markets lower worldwide over the coming days and weeks.

5-25-15 Major Greece Debt Payments

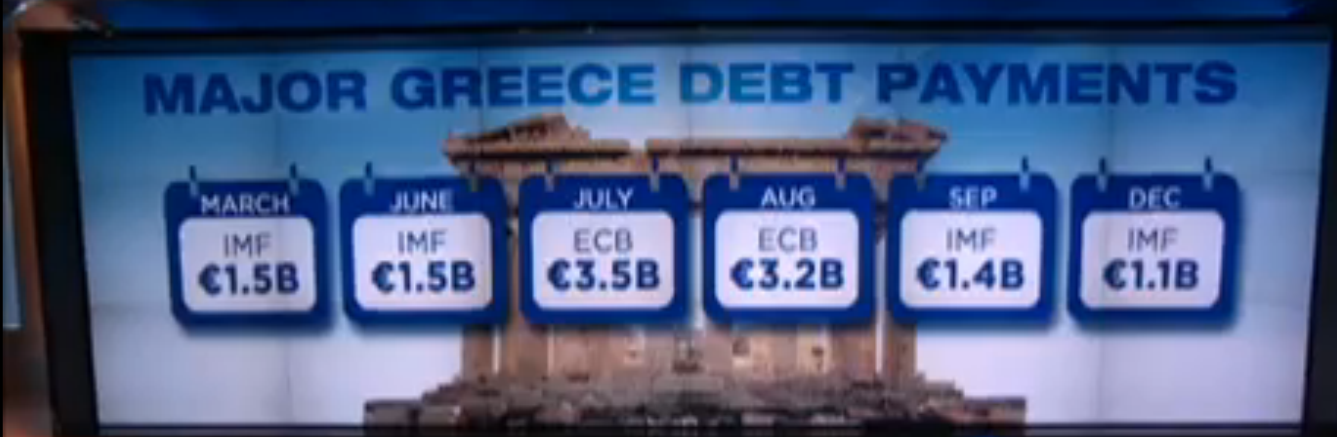
Here (above) are the up and coming Greek Debt Payments… Many are expecting ultimately a default, which could bring about market turmoil.

5-25-15 Greek IMF Payments

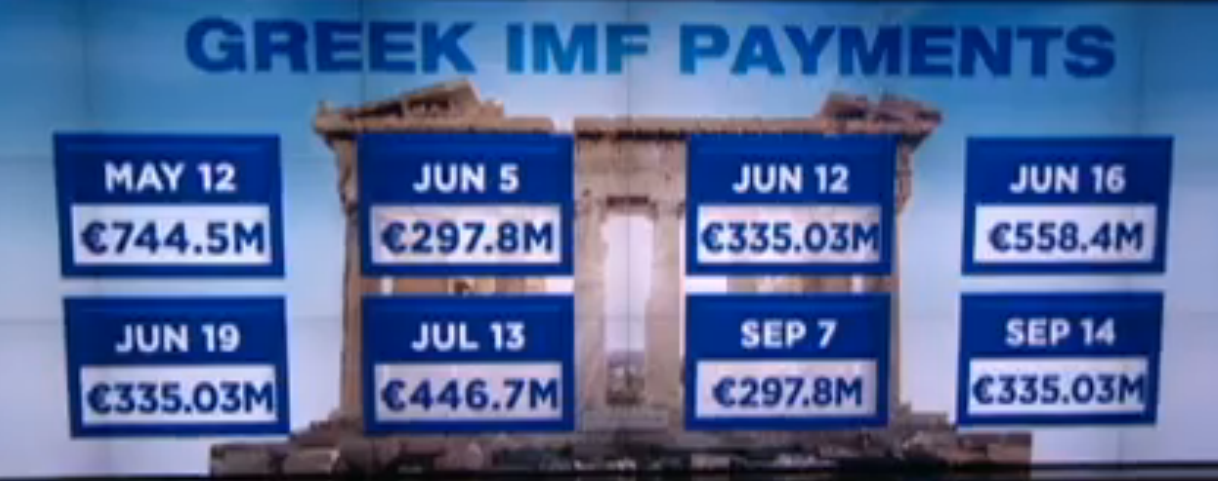
Above is the Greek IMF required payments; Many are expecting a default, which would not bode well for the equities markets, or the fixed income markets worldwide.  There definitely could be some turmoil over Greece’s conduct and behavior going forward.

5-25-15 Indices PE Multiples & Div. Yields

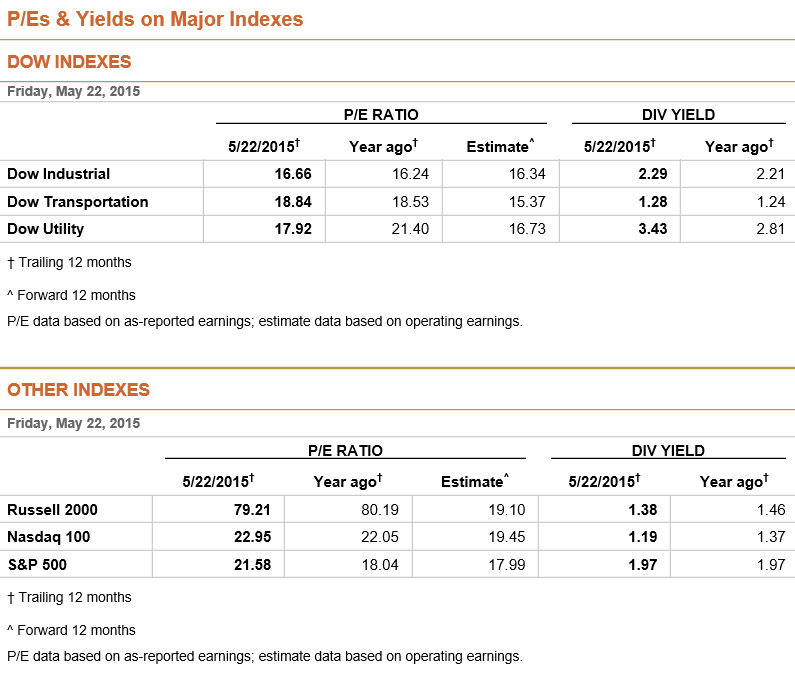
As you can see (above) the PE Multiples are on the rise over the past 12 months, and dividend yields are mixed but on aggregate are flat to up for 12 months.  Press here for the S&PMidCap400’s PE Multiple, at the SSGA’s ETF MDY website, which posts the fund’s characteristics and the index’s characteristics [Click here for the same info on the ETF ticker DIA, the ETF matching the performance of the Dow Jones Industrial Average] [Click here for fund info and index info on SPY and the S&P500] [Click here for fund and index info on QQQ and the Nasdaq-100] [Click here for Fund and Index Info on the ETF IWM and the Russell 2000] [Click here for fund and index info on ETF VTI, formerly known as the Wilshire 5000, now called the Dow Jones U.S. Total Stock Market Index].

I’d wait for a pullback (holding big cash positions) before getting fully invested and/or leveraged in equities, and more aggressive with the equities markets.  I think bonds are in for more dire straights, and interest rates are going to rise in my opinion going forward; Rates were at totally unprecedented lows recently.  How rates ever got that low, and stayed that low for so long, is beyond me!  I can’t believe anyone would lend money to the U.S. Treasury at e.g. 2.33% for 30 year bonds a few weeks ago!!!  Those rates were obscene, and were totally irrational!  Fixed income investors will be treading water for quite some time in my view.  Those invested at the long end are in for some more trouble I think.  I believe that Treasury Security investors will be SHOCKED as to how much they can lose in e.g. 30 year Treasuries, as the duration and interest rate risk is very high (see tickers TLT and ZROZ, both of which are well off their 52 week highs!).  Surprisingly, junk bonds and the high yield markets are nicely priced right now, I’m expecting more of a selloff to continue in Government bonds worldwide than junk and high yield bonds.  You can see evidence of this in tickers: ZROZ, TLT, TIP, EMB, PCY, HYG, JNK, QLTC, etc.

Know historically the stock markets are weak in the months of February, May, and September, according to Barron’s Magazine (I would dispute and research February allegedly being historically weak, but I’ll just report what Barron’s has said recently).

I believe there will be fear mongers warning of a recession looming, due to the weak retail sales, weak producer price index, weak industrial production, an weak consumer sentiment; Not to mention the turmoil in Greece.  I still think that after we get a mini correction the economy, in the USA and worldwide, will improve, bringing equity prices up (after a potential mini correction or full blown summer correction).  There may have been a weak spot in the economic data due to a rather harsh winter season and very bitterly cold temperatures, which held back and discouraged the consumer (the biggest part of the economy) during the first quarter.

I believe there is increased risk of the first rate hike by the FOMC rate hike in 2016 by Yellen, not in September or December of 2015.  Of course, there will be journalists saying and wondering if she’ll raise rates in June 2015.  I believe she’s nearly spelled it out, repeatedly, that the FOMC will not raise rates in June, and at the earliest they might raise rates in September.  Once we get closer to 2016, gurus will say and wonder if she’ll raise rates during an election year.  I believe interest rates, at the short end, are going to remain low for quite some time (while rates at the long end will increase).

There are many who say higher rates will harm REITs (see the ETF ICF), and that it should benefit financials such as those found in the ETF XLF, and regional financials such as those found in the ETF tickers KRE and KBE.

I believe eventually the paranoia over higher rates will subside.  The end of the world is not coming due to higher interest rates at the short end, or even at the long end.  I do not believe the U.S. will have another recession until about late 2017 or 2018 (at the earliest), and for that reason I think the equity markets will continue to grind higher (after we get through some short term volatility and turmoil).  I’m expecting a slight pullback and mini correction, followed by rebounds and a slow grind to higher stock prices for the next year or two.

Just because the market has risen sharply since March of 2009, does not mean it can not continue to increase. After all the annualized performance of the major U.S. Stock Indices since 1999 or 2000 (of roughly zero to roughly plus three-point-seven-seven) has not been anywhere near the longer term historical averages, of approximately plus seven and a half percent per year.

Happy trading!

Andrew G. Bernhardt

[Press Here to Check my Great Links Page]

Sunday, April 12, 2015 – “On the Japanese Stock Market & Economy”

Sunday, April 12, 2015

“On the Japanese Stock Market & Economy”

You may have heard that the Japanese stock market is doing great… Don’t believe it. The Nikkei 225 closed Friday at 19,907.63.  Journalists are claiming this is really great, get in they say, don’t miss out, etc.

GOOD ONE!

Nikkei 225 - 4.10.15

Nikkei 225 on Friday, April 10, 2015

Dec 29, 1989 Nikkei 225's Peak!

Nikkei 225 on December 29, 1989

As you can see, there’s really nothing to celebrate or to get excited about.  The Nikkei 225 on 12-29-1989 was at 38,916, and about 25 years later it’s literally down roughly 50%.  To me that’s totally pathetic.  It’s worse than the lost decade, or the lost quarter century, it’s the lost generation at this point, with zombie banks.  Maybe it’s the lost empire?

The reason the Nikkei 225 is down 50% over 25 years is also a good one.  The Japanese in the 80’s were believed to be so successful that they’d buy the whole world up, and their real estate market was booming!  Then they were plagued with a real estate bubble, recession, and a stock market collapse.  They’ve apparently never recovered.

What would one expect after a totally delusional, market mania, of excessive euphoria, elation, and elevated prices surrounding real estate and high double digit appreciation annually lasting for decades?!

How, seriously, can anyone take any real estate market that appreciates this rapidly, anywhere on earth?  Bubbles go pop!

Additional risks as of late, include their looming demographics issues, involving a generation or two obsessed with birth control pills.  Consequently, the birth rate and the fertility rates have fallen off a cliff.  This is not going to bode well for their economy and their generous entitlement programs.  There are similar problems looming in the USA and in Europe, but not at the scale of the Japanese.  Additionally, the Japanese have been plagued and foiled by a nuclear power plant disaster, tsunami, and earthquake in recent years.

I’m not sure how or why the Japanese government and its people have managed to suffer from deflation nearly every year since their real estate and stock market bubble of the late ’80s.  Did their Central Bank forget that it could print money, and expand the monetary base, and jack up the inflation rate, if it wanted?  Deflation is obviously crippling to any economy, and so I can’t believe they sat around and let that cripple their economy over the past nearly 25 years!  If they had more aggressively printed money, they could have created and constructed low to moderate annual inflation rates, which would have been a much better environment to deal with.

For all these reasons, I would not invest in the Nikkei 225 (see etf EWJ).

Andrew G. Bernhardt

[Click Here For My Great Useful Links Page]

8:45pmCT, Friday, January 16, 2015

Here's the current PE Multiple and Dividend yields of major U.S. stock indices.
Here’s the current PE Multiple and Dividend yields of major U.S. stock indices.

In this post I discuss Index Dividend Yields, Index PE Multiples, Annualized Past Performance, Asset Allocation, Options & Derivative Securities.

As you can see the DJIA is quite reasonable in terms of  PE Multiple, at just 16.19, with forward looking estimates placing its PE Multiple at 15.33 in twelve months time; while the DJIA’s dividend yield has actually increased over the past 12 months to 2.51% from 2.08 a year ago.  This makes me most bullish on the DJIA, and I believe it will outperform the rest of the major U.S. stock indices in 2015 for this reason (the lower pe multiple, relative to other indices, and the strengthening dividend yield on this index).  DIA is an etf that matches the performance of the DJIA, which is a basket of 30 large super capitalization stocks representative of the U.S. economy.  Of course there are options on DIA, and also the CBOE has root symbol DJX and index options on the DJIA with 1256 contract status, which have preferential tax treatment, and cash settlement and European style assignment.

For educational and informational purposes, using options, one could hypothetically construct a portfolio with e.g. 20% allocation to index options achieving 5:1 enhancement, and then he/she could allocate the remainder, the 80% into e.g. high yield fixed income via etfs QLTC, EMB, PCY, JNK, and HYG (alternatively they could use Treasury etfs, e.g. AGG, IEF or TIP, or high quality corporate fixed income etfs e.g. LQD and many others).  This would likely produce awesome gains annually, if rebalanced annually.  This type of strategy is suitable for institutional trading, and it achieves the “best of both worlds” in terms of a large fixed income portfolio, for safety, and then an index option which would effectively capture the gains of the stock market over e.g. the course of a year or two.  A lot of investors, including institutional investors, “dilute” their equity portfolio’s potential gains with fixed income, which over time can produce returns less than the stock market (assuming high yield bonds are not employed).

What most people don’t know is that e.g. the JPM EMBI [which stands for the J.P. Morgan Emerging Market Bond Index] (matched by etf EMB, and many other higher cost mutual funds, like FNMIX, PEMDX, and GSDAX) has produced annualized gains over the past which are awesome, sometimes beating stock indices.  Over the past 12 months (according to https://fundresearch.fidelity.com/mutual-funds/performance-and-risk/315910836 the JPM EMBI has returned (through December 2014) +5.53%, and over the past 3 years the annualized return was +5.33%, over the past 5 years the annualized return was +7.21%, and over the past 10 years has produced annualized gains of +7.68%.  The high yield bond markets and high yield fixed income indices (rated BB or better, and the etf EMB meets that requirement) have never returned a negative return over any rolling 18 month period of time. This means that if there ever is a selloff in these fixed income indices it’s most likely a major buying opportunity, and based on past performance since the stone age, that the index will strike a new all time high within 18 months.  This is not the case for equity indices, which e.g. took 25 years from 1929 to 1954 to break even, even before inflation adjustments; also the Nasdaq Composite hasn’t reached it’s March 2000 levels of roughly 5,134, also before inflation adjustments, and it has been 15 years!  The etf PCY is very similar to etf EMB and has a slightly longer average weighted maturity, compared to EMB; It was designed by Deutsche Bank to outperform the EMB by 200 bp per year. Other corporate U.S. high yield bond funds rated BB or better include JNK, and HYG; of course there are many others.  There are also higher risk CCC rated fixed income mutual funds and etfs, including QLTC.

I have personally annualized the S&P500, and it has returned over the past ten years +5.238%, going from a December 31, 2004 value of 1,211.92 to the current 2,019.42 (derived from [2019.42/1211.92]^[1/10]).  Yes, you’re reading this correctly, high yield fixed income (as measured by the JPM EMBI) has outperformed the S&P500 over the past 10 years, each and every year (on average) by nearly +2.44%, and an extra 244 bp adds up quick over long periods of time.  It is said there’s nothing more powerful than compound returns.  Over the past 20 years the S&P500 has risen from 459.27 to the current 2,019.42, which annualizes to +7.6857% over the past 20 years through today (derived from [2019.41/459]^[1/20]).  I’d rather have bond market (aka fixed income) risk(s) than stock market risks.

Speaking of fixed income risk, here they are: Fixed Income Securities (including U.S. Treasury Securities) have default risk, interest rate risk, inflationary risk, liquidity risk, currency risk, credit quality risk, repayment or principal risk, streaming income risk, reinvestment risk, duration risk, convexity risk, maturity risk, market risk, political risk, and taxation adjustment risk, despite the caveat of “full faith and credit of the US Government” for US Treasuries.  Makes you wonder doesn’t it!  Just joking, obviously, fixed income is safer than equities, even when analyzing high yield fixed income indices.

Here’s the annualized data on the DJIA, which I have just personally calculated for you.  It closed today at 17,511.57, and in December of 1994, the last trading day of the year it closed at 3,834.44. So for 20 years the annualized DJIA return has been +7.890% (calculated from [17511.57/3834.44]^[1/20]).  For ten years the annualized return for the DJIA  has been +4.968%, going from 10,783.01, on the last trading day of 2004, to the current 17,511.57  (calculated from [17511.57/10783.01]^[1/10]).

In December of 2004, on the last trading day of the year, the S&PMidCap400 closed at 663.31, today it closed at 1,430.89; This annualizes to +7.991%, derived from [1430.89/663.31]^[1/10].

This is why my main “master strategy” (which after trading options for ten years I believe to be the best) has been to amplify the stock indices (rebalanced annually) using stock index options (which for safety have an expiration date going out more than two years), with 10 to 25 percent allocations, and enhancement ratios of 5:1 to 7:1 (this would require a level II purchase of a deep in the money call index option, and perhaps the selling or writing of an out of the money call, to mitigate extrinsic value decay, by turning the trade into a level III e.g. vertical bull call debit spread— potentially making the options positions theta positive); while placing the remainder, the 75 to 90 percent, into high yield fixed income.  I’m sure you can do the math, to discover what that hypothetical portfolio construction strategy annualizes, based on long term past performance figures.  Amazing isn’t it?!  Who can beat that?!

By Andrew G. Bernhardt