Tue, Feb. 10, 2015 “Stock Market Rally on Broad & Wall”

On the Securities Action of Tuesday, February 10, 2015

“STOCK MARKET RALLY ON BROAD & WALL!”

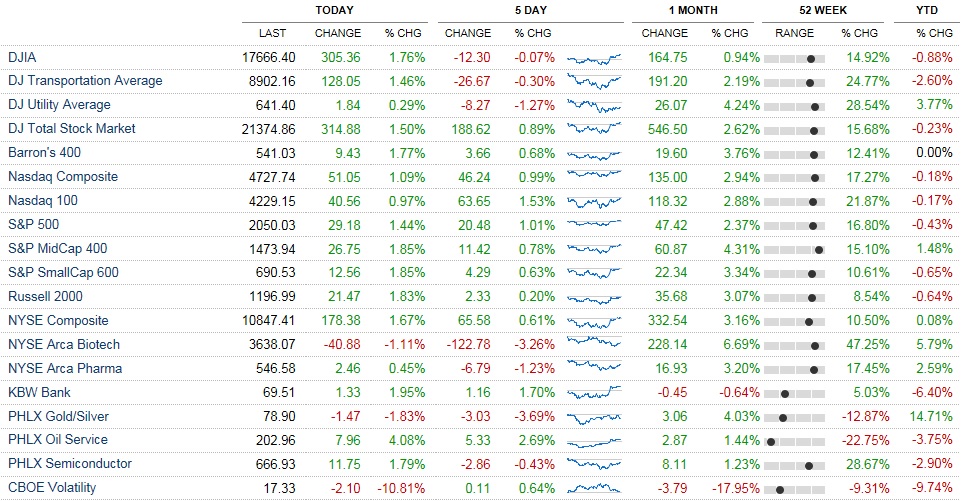
STOCKS GAINED GROUND ON TUESDAY! Tuesday saw most major U.S. stock indices increase by about +0.70% to +1.30%.  Volatility, as measured by the VIX decreased by -1.32 points or -7.12% to 17.23. The DJIA +139.55 points to 17,868.76; The S&P500 +21.85 points or +1.07% to 2,068.59; The S&PMidCap400 +11.13 points or +0.76% to 1,480.59.  See the graphic below for daily and past 5 day performance of the U.S. Major Stock Indices.  In fixed income Tuesday saw all Sovereigns including Treasuries, trade lower, while U.S. Corporate high yield traded higher.  See the graphic below to see how fixed income faired Monday.  I continue to believe the major U.S. stock indices will soon plow through previous all time highs, by three to four percent, before taking a few steps back, before making another advance higher.  I believe the only thing that could delay this would be pessimism on Greece and also on Russia’s sabre rattling.  Germany is likely going to “bail out” Greece again;  They’ve got too much to lose if they decided not to bail out Greece.  However, I continue to remain bullish, and I believe energy shares and crude oil will trade in a volatile range, but will trade higher given a month or two or more, which I believe will lift all major U.S. Stock Indices to new highs; as it will certainly bode well for the energy sector’s shares.  Lastly, I think that higher energy prices will bring “hot” (meaning higher than usual) CPI-U monthly figures, which will put upward pressure on fixed income yields in the open market, particularly in the Treasury long term and intermediate maturity sectors.  The average monthly CPI monthly increase has been approximately +0.20% historically in the past;  Since oil’s “demise” (of late June 2014) month to month CPI figures have been quite low, closer to zero, if not negative.  As energy prices (primarily light sweet crude oil) rebounds, I’d expect the monthly CPI-U figures to come in “hot” at nearly twice to three times the historical average, at literally +0.4% to +0.6% month to month for a while.  Treasuries are (by a week or two) just off prices of nearly unprecedented highs, due to unprecedented low yields that were struck.  Thirty year zeros are down by -10.25% off their all time highs as measured by etf ZROZ, and I believe they’ll never see those highs again, or at least, for many many years.  Conventional thirty year Treasury bonds are down by -6.35% off of their price peak, as measured by the etf TLT, which also may never see its highs again, or at least for a very long time.  Interest rates were at historical and unprecedented low yields!  Long term (and intermediate) Treasury yields have no where to go but upwards, which will bring Treasury prices down further, due to higher and higher yields.  High yield fixed income is not at unprecedented low yields, and therefore, may not sell off as strongly as Treasuries, given equal maturities.  I fear most for long term maturities and their investors.  Higher or “hot” CPI-U monthly figures could also put pressure on the FOMC to raise rates, perhaps as early as this summer.  The CPI can be greatly influenced by volatile energy (as in light sweet crude oil) prices.  Higher yields at the short end (raised by the Federal Reserve) are likely to push rates up across the board, in intermediates and long term Treasury yields.  I wouldn’t be surprised if long term Treasury Securities saw negative total returns over the next 36 months.  I believe, long term maturity Treasury bond investors (and perhaps intermediate Treasury note investors) are in for “A BIG SURPRISE(!!!),” called negative total returns over the next three years, as rates begin to “normalize” in the USA.  I believe investors will be totally shocked at how much can be lost in a Treasury bond as rates increase.  If rates rise by 200 basis points at the long end, there could literally be 30% losses for Treasury bond investors.   Additionally, there could be nearly literally 60% losses for 30 year Zeroes in the Treasury Bond market.  Interest rate risk is measured by duration.  Swim at your own risk!

[Click here for current Yields on Treasury Securities, http://finance.yahoo.com/quotes/^IRX,^FVX,^TNX,^TYX]

2-10-15 BQ

Feb. 10, 2015, Major U.S. Stock Indices

[http://finance.yahoo.com/futures  Click here for an energy prices update] Friday saw USO an etf of West Texas Intermediate decrease by -4.20% to 18.94; USO is now -51.98% off its peak of the past 12 months; reached in late June ’14;  USO is also +16.20% off rock bottom, set on January 29th at 16.68.  I believe oil will remain very volatile, perhaps an options strategy called an at-the-money straddle using two week out expirations could prove to be very lucrative; I believe oil is going a lot higher (maybe another 10% or more), and soon (over the next few weeks).  I would base this estimate of mine on the oil-VIX which is very elevated right now.  If the oil-VIX implodes, it will bring higher oil prices.  Another strategy that could prove to be lucrative for options traders would be a long bull call ratio back spread on USO. On Tuesday light sweet crude oil traded lower  by -5.37% or by -2.84 per barrel to $50.02.  Higher oil likely sent the Russian stock market (as measured by the etf RSX) up by +2.01% to 16.74; RSX now stands -39.04% off its peak of the past 12 months, while also now trading at +33.92% off rock bottom.  [Click here for an Oil-VIX chart & update http://data.cnbc.com/quotes/.OVX]

 2-10-15 BSQ

Select Quotes of Interest, Feb. 10, 2015

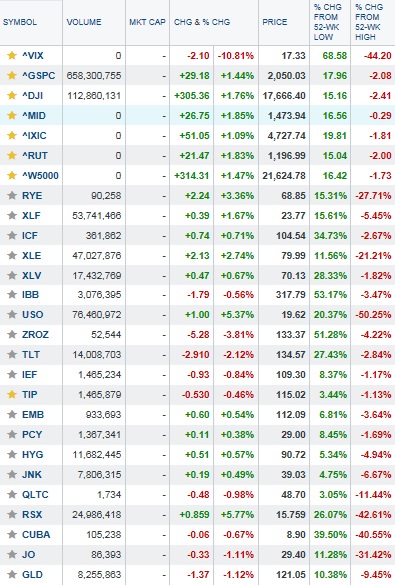
In the Fixed income markets, see the graphic above to see how Treasury etfs traded (ZROZ, TLT, IEF, TIP) and how high yield etfs traded (U.S. dollar denominated high yield sovereigns being etfs EMB and PCY; As well as high yield corporate fixed income etfs being HYG, JNK, and QLTC).  The 30 year Treasury Bond yield closed at 2.58%, and the 10 year Treasury Note yield closed at 2.01% [Data from here: http://www.treasury.gov/resource-center/data-chart-center/interest-rates/Pages/TextView.aspx?data=yield]. I continue to believe, and will reiterate, that if oil can stabilize in a trading range, or start to appreciate, that there will be some major opportunities in the energy sector in equities, and in their high yield fixed income; Also I continue to believe that when oil stabilizes (or begins to appreciate) that there will be some major opportunities in high yield fixed income funds, such as the ones listed above, EMB, PCY, HYG, JNK, and QLTC.  When higher energy prices materialize in the future, inflation could pick up as measured by the CPI-U, which may or could send e.g. Treasury Security yields higher, while also pressuring the FOMC to raise rates at the short end.

Tuesday saw the US Dollar trade slightly lower versus the Ruble, and slightly higher versus the Euro; The Euro lost approximately -0.08%, as measured by the etf FXE.  I continue to believe the Ruble and the Euro are still too high, and will further deteriorate, making the dollar stronger.  This may lead to higher U.S. trade deficits, and a higher quality of living for those in the USA, as our dollar will be able to purchase more abroad, effectively “importing deflation” a disflationary pressure. The U.S. Dollar can now be exchanged for a Euro at a cost of approximately $1.1319, and also can now be exchanged for 65.7245. Rubles.  [http://finance.yahoo.com/currency-investing  Click here for an update on all major cross rates]

I believe the catalyst for today’s stock market gains involved Greece and speculation that Germany is going to bail them out, yet again;  Investors are worried about a possibility of a “Grexit,” meaning that Greece may exit the Euro Union and/or the Euro Zone, and halt its use of Euros, etc.  However, the European Union likely will put pressure on Greece to stay in the Euro, since its invested so much into bailing it out already;  Consequently, shares in Greece gained ground strongly as pessimism dissipated.  An etf of Greek stocks (etf ticker GREK) increased by +7.62% to 12.28.

[Click here for updates on Futures vs. Fair value, http://www.cnbc.com/id/17689937]

HOT and Z will both reported eps Tuesday after the close.  I believe that Z could move about ±6.80 per share just after it reports its eps.  In afterhours trading HOT and Z don’t seem to be moving much;  We’ll see how the hype trades tomorrow, it’s always amusing.

I would suggest that perhaps a long bull call ratio back spread with net credit characteristics may be lucrative; Especially if also combined with a long bear put ratio back spread with net credit characteristics on any particular “hype stock” just before eps are released; Placing the trade just a minute or two before the close (3:00PM Central Time) on its earnings release date (if it reports that day after the close, or the next morning before the opening bell).  It certainly is amusing to see what happens to hype stocks just after their eps releases in the aftermarkets and on the first full day of trading post eps.  Most sink fast!  

“Hype stocks” to me would be e.g. GOOGL, TSLA, PCLN, FB, AAPL, LNKD, AMZN, EBAY, NFLX, TWTR, BABA, GPRO, and Z, and also what I would describe as “Big Momentum Players” such as e.g. CMG, GMCR, AZO, V, and MA etc. (a sub group of hype to me).  This list of Hype and Big Momentum Players is just off the top of my head, and is in no particular order, nor is it any particular science for choosing these types of volatile securities.  RSX, GREK, TUR, FXI, EWZ, and CUBA are also very volatile etfs found in places worldwide with high geopolitical risks.  West Texas Intermediate matched by the etf USO is also a very volatile etf to trade as of late.

I will continue to reiterate that I’m currently bullish on the major U.S. stock indices.  I believe a theme of higher crude oil prices will potentially materialize over the next few weeks, if not becoming more of a longer term theme, for the next year, if not longer.  I also believe and would reiterate that the geopolitical risks involving Greece’s sovereign debt and interest payments will be resolved, and also that Russia may stop sabre rattling soon.  This will bring about higher prices for stocks, and for all major U.S. stock indices, which could reach new all time highs very soon.  I also think that investors may begin selling longer duration and longer maturity fixed income of all kinds, and with the proceeds they may purchase stocks, resulting in higher yields on fixed income, and also higher stock prices.  I also believe investors will “go on a dividend hunt,” and/or will “go on a financials hunt” with their raised cash from any potential future fixed income selling.  Higher energy prices (of light sweet crude oil and/or west Texas intermediate) may bring about higher monthly CPI-U inflation figures, resulting in a fixed income sell off, and higher interest rates, over the next 6 to 12 months, if not for the next 36 months, as rates normalize in the USA (and potentially elsewhere in other nations).  Interestingly, I believe that the higher credit quality fixed income may sell off more than the lower credit quality fixed income.  I would base this upon the unprecedented low sovereign yields worldwide (which in some countries are literally negative) and in the USA.  To me, this means that Treasuries at the long end, may suffer great losses as rates “normalize.”  For 2015 I am most bullish on equities and the S&PMidCap400, the S&P500, as well as the DJIA (which has the lowest PE Multiple among all the major U.S. Indices).  I am also bullish on Financials, and REITs (particularly Hospital REITs such as HCP, HCN, SBRA, OHI, NHI, due to their strong dividends, and historical dividend growth), and the “Big Tobacco” (e.g MO, PM, RAI, BTI, etc., due to their strong dividends, and historical dividend growth) sectors;  In fixed income I like high yield etfs e.g. EMB, PCY, JNK, HYG, and QLTC.  Options can be used to “hedge” fixed income ETFs as well, in strategies such as level one covered call writing (of e.g. at-the-money monthly calls against the fixed income ETFs).  Trading very deep in the money call options (with expirations two or three years into the future) on stock indices, combined with very high allocations to high yield fixed income could prove to be a great lucrative strategy if rebalanced annually;  Selling weekly or monthly expiration, slightly out of the money calls by e.g. 1.5%, against the long calls, could also prove to be very lucrative; Effectively morphing the trade into a level three long diagonal bull call debit spread).  If the JPM EMBI (matched by etf ticker: EMB) is good enough for the fixed income of the Yale and Harvard Endowment funds (and other large time institutional entities) then why trade Treasury Securities?!  I think people (or any entity) who buy Treasuries are “ripping themselves off!” (even when rates are not forecast to increase)  Treasuries, to me, generally speaking, are for short term investing, and maximum preservation of capital (I believe, this may only be achieved with short term Treasuries going forward for a year, or two, or longer- as I believe interest rates, and the CPI-U inflation figures will increase faster than expected, and faster than is the historical average going forward over the next year).  I’d estimate that the CPI-U may increase by roughly +3.60% to +4.20% over the next 12 months.  It may be a great time to invest in TIPS (Treasury Inflation Protected Securities, at the short end) via etf ticker STIP (for maximum preservation of capital style investing).  Interestingly, all high yield fixed income indices (which are BB rated) have, over the long run, always closed at a new all time high every 18 rolling month period.  Consequently, every or any time that high yield fixed income indices are trading well off their all time highs, I’d view it as a major buying opportunity!  Happy Trading!

By Andrew G. Bernhardt

On the Securities Action of Tuesday, February 3, 2015 “BIG RALLY AT BROAD & WALL!”

On the Securities Action of Tuesday, February 3, 2015

“BIG RALLY AT BROAD & WALL!”

BIG RALLY ON WALL STREET! Tuesday saw a continuation of a broad based rally across the board on The Big Board. Volatility, as measured by the VIX imploded and was -10.81% to 17.33. The S&P500 finished up + 1.44% or +29.18 points to 2,050.03, the DJIA was up +1.76% or +305.36 points to 17,666.40.  The S&PMidCap400 rose +1.85%  or +26.75 points to 1,473.94.  In fixed income, Treasuries were down while high yield sovereigns and BB-rated high yield corporate debt rallied, while CCC rated declined.  The major U.S. stock indices are now within striking distance (about -1.7 to -2.4 percent) off their all time highs, which I think they will soon plow through by three to four percent, before taking a few steps back, before making another advance higher.  I continue to remain bullish, and I believe energy shares and crude oil will trade upwards, which I believe will result in higher shares across the board, lifting all major U.S. Stock Indices.

2.3.15

Feb. 3, 2015, Major U.S. Stock Indices

2.3.15 Select Quotes of Interest

Select Quotes of Interest, Feb. 3, 2015

[http://finance.yahoo.com/futures] Click here for an energy prices update.  Tuesday saw USO an etf of West Texas Intermediate rise by +5.37% to 19.62.  This is the third day of gains, and USO is now +20.37% off of rock bottom.  I believe oil will go higher, over the short run and long run; It settled around 52 per barrel on Tuesday.

In the Fixed income markets, ZROZ traded lower, down -3.81% to 133.37, TLT traded down by -2.12% to 134.57, IEF traded lower by -0.84% to 109.30, TIP was down -0.46% to 115.02. EMB was up +0.54% to 112.09, PCY was up +0.38% to 29.00, HYG was up +0.57% to 90.72, JNK was up +0.49% to 39.03, and QLTC traded lower by -0.98% to 48.70. The 30 year Treasury yield settled at 2.37%, the 10 year Treasury yield settled at 1.79% [data from here: http://www.treasury.gov/resource-center/data-chart-center/interest-rates/Pages/TextView.aspx?data=yield]. I continue to believe, and will reiterate, that if oil can stabilize in a trading range, or start to appreciate, that there will be some major opportunities in the energy sector in equities, and in their high yield fixed income; Also I continue to believe that when oil stabilizes (or begins to appreciate) that there will be some major opportunities in high yield fixed income funds, such as the ones listed above, EMB, PCY, HYG, JNK, and QLTC.

The US Dollar traded lower versus the Ruble and the Euro on Tuesday; the Euro gained approximately +1.30%, as measured by the etf FXE. I continue to believe the Rouble and the Euro are still too high, and will further deteriorate, making the dollar stronger. The U.S. Dollar can now be exchanged for a Euro at a cost of approximately $1.1479, and also can now be exchanged for 65.0995 Rubles, which is three Roubles and change less than yesterday.  [http://finance.yahoo.com/currency-investing]  Go here for an update on all major cross rates.

I believe the catalysts for today’s stock market gains were predominately higher oil and energy prices, as well as Greece sovereign debt pessimism mitigating.  I believe that oil shares and crude oil itself will trade flat to up, and that all major stock indices will trade higher.  I also believe that oil could prove to be very volatile; so perhaps an option strategy called an at-the-money straddle could be lucrative when choosing expirations about two weeks away.  Another strategy that may be lucrative on higher oil prices would be a married put trade, on e.g. the etfs XLE and/or USO, or on individual energy related shares, such as XOM, BP, CVX, BPT, COP, or RIG, etc.

Economic data releases on Tuesday were strong across the board; auto and truck sales reached the highest level going back several years.  Total vehicle sales came in 100,000 units greater than consensus estimates; 16.7 million units were sold. Wednesday the 4th will see MBA Mortgage Index, ADP Employment Change, ISM Services, and Crude Inventories economic data releases.

In notable eps reports releases I had speculated yesterday that CMG would be amusing, as would WYNN.  Both eps reports were released after the market close on Tuesday the 3rd. I had said that CMG may move by ±51.00 on Wednesday, during the full trading day after it reports eps. Fasten your seat belts, because it’s down STRONGLY in afterhours! I had suggested that perhaps a long bull call ratio back spread with net credit characteristics may be lucrative; Especially if also combined with a long bear put ratio back spread with net credit characteristics on CMG, placed today just a minute or two before the close (3:00PM Central Time) on February 3rd could prove to be lucrative.  Looks like that estimate and projection is going to materialize. I had suggested also that WYNN could perhaps move by ±7.70;  Looks like that’s going to materialize also. It will be amusing to see what happens Wednesday.  

Wednesday, after the close GMCR (which closed at 126.09 per share on Tuesday) reports eps; consensus estimates are for 89 cents per share. GMCR looks to me like it might move by about ±11.50 per share after reporting eps.  I continue to believe that long bull call ratio back spreads with net credit characteristics, initiated simultaneously with long bear put ratio back spreads with net credit characteristics (initiated just minutes before the closing bell) could prove to be a very lucrative trading strategy, when focused on “HYPE(!!!) stocks” (like GMCR, and many others) just prior to their eps releases.  Happy earnings speculation!

I will reiterate that I’m currently bullish on the major U.S. stock indices, because I believe that higher crude oil will lead the energy sector shares higher, dragging everything up with it.  This theme will potentially materialize over the next few weeks, if not becoming more of a longer term theme, for the next year, if not longer.  I also believe that the geopolitical risks involving Greece’s sovereign debt and interest payments will be resolved, and that Russia may stop sabre rattling soon.  This will bring about higher prices for stocks, and for all major U.S. stock indices, which could reach new all time highs soon.  I also think that investors may begin selling longer duration and longer maturity fixed income of all kinds, and with the proceeds they may purchase stocks, resulting in higher yields on fixed income, and also higher stock prices.  Interestingly, I believe that the higher credit quality fixed income may sell off more than the lower credit quality fixed income.  I would base this upon the unprecedented sovereign yields worldwide and in the USA.  High yield fixed income yields are not at all time lows, but e.g. Treasury yields are at nearly all time lows.  To me this means that Treasuries at the long end, may suffer greater losses on a percentage basis versus their high yield counterparts.  For 2015 I am most bullish on equities within the Financials, REITs, and “Big Tobacco” sectors;  In fixed income I like high yield e.g. EMB, PCY, JNK, HYG, and QLTC.  I’d likely trade deep in the money calls on stock indices, combined with high allocations to high yield fixed income.  I’d use longer dated expirations for the long deep in the money index calls. I like index calls because they have IRS 1256 contract status for preferential tax rates, versus etf options, which do not have IRS 1256 contract status.  I’d occasionally write calls against the long calls, writing front week (or two weeks out to expiration) expirations (repeatedly at my discretion- where I believe we may be at a peak… I’d sell ATM calls or slightly out of the money (by one to two percent) calls against the long calls), adjusting the trade into a long diagonal bull call debit spread.  This is “my two cents” on the markets, and investing, and eps speculation as of late.  Happy trading!

By Andrew G. Bernhardt

8:10pmCT, Sunday, January 18, 2015 “On Energy, Oil, Russia, Speculation, and Future EPS Releases”

Multa abscondita lapidibus.

“Many Hidden Gemstones!”

Diamond in the rough!”

The past two days has seen a surge in the prices of light sweet crude oil and also of brent crude oil. [Press here for a 6 month chart of oil]. As you can see, crude oil has depreciated from 101.33 dollars per barrel (reached on June 25, 2014) to the current 48.61. This is a drop in magnitude of -52.03%. Oil was substantially lower just a few trading days ago. It seems to have in retrospect, to have reached a low of 44.55 on Tuesday, January 13, 2015. So it’s rocketed +9.11% off of the rock bottom set on Tuesday. Despite this nearly 10 percent move, I think oil has a lot higher to go. Take a look at the oil volatility chart [Press here for 12 month chart of Oil’s VIX]. Tickers USO (-53.5% off its peak) and OIL (-57.28% off its peak) are etfs that match the performance of West Texas Intermediate Oil, and Brent Oil, and there are listed options on both of these etfs.

As you can see, there’s an inverse correlation noteworthy of significance between the trajectory of any particular volatility index, and the trajectory of the underlying security or commodity the specific volatility index is associated with. I think oil’s volatility has a lot further to fall, it may even implode, so that translates to “oil is going to move higher.”

If oil is going to move higher, then all energy related shares are going to (or may) move higher (see etf XLE which is still -25.90% off its peak). In addition to energy related shares moving higher, I think mostly all high yield bonds are going to move higher, as the energy sector has representation in high yield fixed income indices (see etfs HYG JNK QLTC). HYG is -6.14% from its peak, JNK is -7.63% off its peak, QLTC is -12.22% off its peak. I would also suggest or estimate that high yield sovereigns are going to rally, if oil can continue to hold its current value, or appreciate (see etfs EMB and PCY, both of which are U.S. Dollar denominated, despite being associated with foreign government high yield fixed income indices… this is because foreign governments sometimes borrow money in U.S. Dollars, and they pay interest in U.S. Dollars). EMB is -4.74% off its peak, and PCY is -3.83% off its peak. Lastly, the Russian Ruble and the Russian stock market (see etf RSX, currently -44.95% off its peak) may appreciate, in the short run, if oil can hold steady or appreciate. Many are worried about a Russian total default, so longer term, the coast is not clear, and the Russian economic (and political) storm continues.  Russia is in the middle of a currency crisis, with the Ruble down nearly 50% over the past six to twelve months; Russian interest rates also seem to be surging. When will Russia’s war and/or hostile military actions against its neighbors end?

If Russia’s military hostility were to end, the stock and bond markets could really take off to the upside. I wonder when that day will come?

In the energy sector here are some Tickers I like to follow. I monitor the following tickers in the energy related sectors: XOM, CVX, BP, BPT, PBR, RIG, SPH, PAA, BIP, HAL, PSX, ECA.

Please keep in mind the energy sector is highly volatile, and may struggle for a while.  Prices of oil have fallen so far and so fast that drilling projects are being shut, there have been layoffs, and their EPS and revenue will likely be terrible versus last year.  The shoe-to-drop after that may be that management teams of energy related companies they may elect to cut their dividends, which would be a major catalyst for another wave of selling in the energy sector.

Options traders and investors that use options along with stocks, may really want to consider trading some married put (aka protective put) strategies in this space on XLE, individual energy sector stocks, and/or on e.g. USO.  Other options traders may want to consider purchasing deep in the money calls on USO, with expirations of January 2017.  If I was serious about amplifying USO I’d likely initiate a vertical bull call debit spread, by purchasing e.g. the 13 strike price calls, and then simultaneously selling the 26 strike price calls, using the January 2017 expiration (this strategy calls for being long the same number of contracts that you’ve written and are short).  I’d also consider doing a diagonal bull call debit spread, which is very similar in strategy to the vertical bull call debit spread example above, only you write (aka short) a closer to front month, or a front week option against the long calls.  I’d likely go long the same 13 strike price calls with the January 2017 expiration, and I’d then look to short (aka to write) closer to front week or front month calls against it, repeatedly, leading up to the January 2017 expiration.

[Click here for quotes on every ticker and ETF I mentioned in this Blog Post].

I hope you find the below graphic helpful in analyzing which stocks are well off of their peaks, and what their current dividends are.  Again beware of the EPS reports looming for XOM, CVX, BP, and others scheduled for release in the next two to three weeks.  XOM is scheduled to release its EPS report on February 2, 2015 before the opening bell; CVX is scheduled to release its EPS report on January 30, 2015 before the market open; and BP is scheduled to release its EPS report on February 3, 2015 before the opening bell.

[Press here to look up future EPS Release Dates by ticker symbol]

By Andrew G. Bernhardt

This is the way I like to look at securities.  Notice the strong dividend yields.  We'll find out if management will cut the dividend.
This is the way I like to look at securities. Notice the strong dividend yields, after their precipitous sell off. We’ll find out if management teams will cut the dividends.  Notice the strong yields on RIG and BPT.