Thursday, December 31, 2015
Market and Economy Checkup
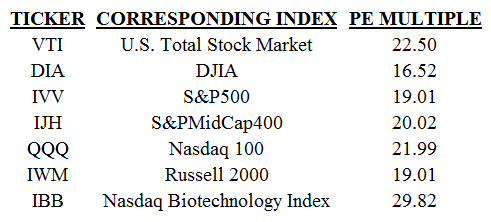
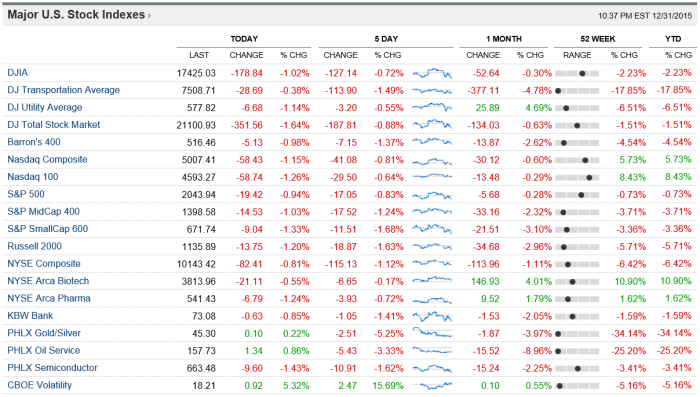
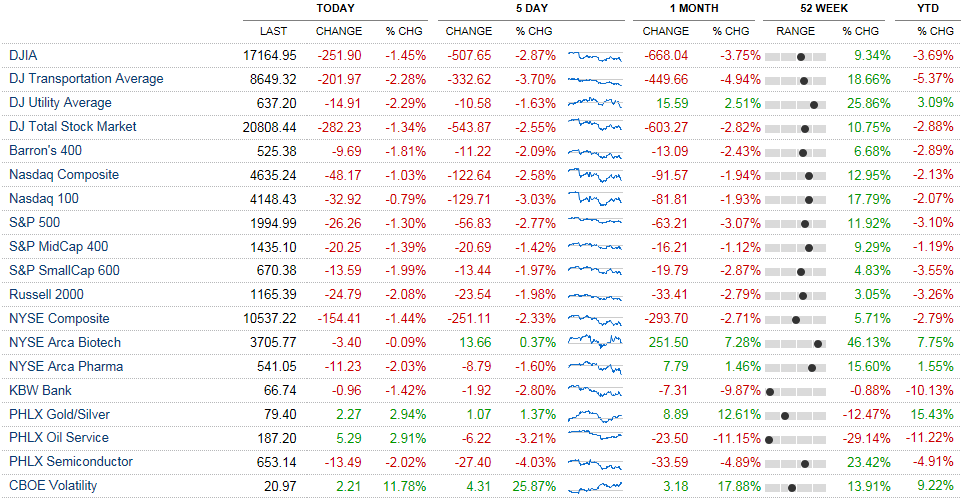
As you can see, today, this week, this month, and spanning over the past 12 months has been a disappointment for equity investors. The only bright spots have been the Nasdaq (ticker ONEQ +5.93% YTD) and the Nasdaq 100 (ticker QQQ +8.43% YTD), and Biotech (tickers IBB +11.47% YTD, and XBI). The Cohen & Steers Realty Majors Index, matched by ticker ICF, posted a +5.96% return in 2015. Additionally, U.S. Total Stock Market Index, formerly known as the Wilshire 5000, (ticker VTI) posted +0.40% YTD. Winning sectors in the S&P500 (which finished 2015 -0.73%) included Technology Sector (ticker XLK), Health Care (ticker XLV), and Consumer Discretionary (ticker XLY), and Consumer Staples (ticker XLP).
Click here for quotes on the ticker SPY, and all of the SPDR Sector ETFs which match the performance of the sectors constituting the S&P500. Here’s how some indices and sectors and their ETFs did for 2015, ranked in order, from biggest winners to biggest losers (results were taken from a price chart, so this includes price performance only, not including dividends, and also does not include capital gains distributions):
- IBB the Nasdaq Biotech Index, a widely followed sub-sector of health care wins first place.
- QQQ, the Nasdaq 100, wins second place.
- XLY, Consumer Discretionary wins third place.
- XLV, Healthcare, wins fourth place.
- XLP, Consumer Staples, wins fifth place.
- XLK, Technology, wins sixth place.
- The S&P500 itself finishes for seventh place, down for the year.
- DIA, the DJIA finishes down for the year, in eighth place.
- IJH and MDY, the S&PMidCap400 finishes down for ninth place.
- IWM, Russell 2000 finishes worse, down for the year, and in tenth place.
- XLF, Financials, were next, finishing down for the year, in eleventh place.
- XLI, Industrials were next, finishing down for the year, and in twelfth place.
- XLU, Utilities, were next, finishing down worse still for the year, and in thirteenth place.
- XLB, Basic Materials, finished down, second to last, in fourteenth place.
- XLE, Energy, finished down and in last place, fifteenth place. (And after being down so sharply over the past 18 months, something tells me that the energy sector could prove to be a winner going forward, at maybe some point between now and the next six months or so.)
- Worse still were many foreign stock ETFs, of Europe, the Middle East, China, India, Brazil, The frontier markets, South Africa, Africa, S.E. Asia, Latin America, etc. (click here for quotes on these losers), know that it can always get worse before it gets better, so don’t be too tempted to buy these foreign stock ETFs. I’ve always said foreign stocks are like gambling and/or lottery tickets! Now there’s always exceptions to what I’ve said, e.g. I like CS, DB, GSK, MNK, BCS, and LYG, which are all foreign domiciled “big pharma” and financials. On that note, checkout ETF ticker ADRU, which is laden with foreign companies (mostly ADRs listed in the U.S.) that might maybe be worth an investment.
There are three strategies that can be put into action on the last day of the year, the first is called “The Bridesmaid Strategy,” second, “The Dogs of the Dow Strategy,” and lastly, the third, “The Small Dogs of the Dow.”
1. The Bridesmaid Strategy is simple, you simply select the 2nd place winner among all S&P500 sectors, which is healthcare for 2015, and you invest solely in that sector for the following year, being 2016. This strategy is said to beat the S&P500 by over four hundred and eighty basis points (meaning by +4.80%) per year on average, over the long run. So, 2016’s Bridesmaid Strategy would entail investing in the S&P500’s Health Care Sector, matched by ETF ticker XLV.
For further info on “the Bridesmaid Strategy” click here. The article claims The bridesmaid strategy has an annualized return of +14.50% since 1991, and over that same span (since 1991) the S&P500’s annualized return was +9.70. Seems as though the bridesmaid strategy is absolute dynamite!!!
I’d also note that biotech (which is not a sector of the S&P500, it’s its own index), matched by the ETF ticker IBB, and other healthcare related ETFs could prove to be great investments in 2016, see tickers IHE, XPH, SBIO, and others.
Know that despite the health care sector’s strong performances over the past few years, like everything else, past performance is not indicative of future performance, and does not guarantee future results. Swim at your own risk!
2. Also, Click here for 2016’s Dogs of the Dow Components. Click here for an explanation on how (A) the Dogs of the Dow (and (B) the Small Dogs of the Dow) are selected. It’s really a great time tested strategy. The Dogs of the Dow strategy involves selecting and investing in an equal weight 10% allocation, the 10 highest yielding stocks taken out of the DJIA (on the last trading day of the year); The Small Dogs of the Dow Strategy then chooses only five (out of ten) from that list, in equal weight (20% each), which are the lowest in price per share.
Leading the way down in 2015 was the energy sector (XLE) (and iShares ticker IYE, -22.21% YTD), plagued by sharply declining crude oil prices, from too much supply, rather than lack of demand. Their man made supply side shock could put them out of business, and has also caused terrible recessions in Brazil (in 2016 many believe Brazil could turn, and ticker EWZ (-41.27% YTD) could prove to be a major opportunity for speculators, after nearly 8 to 9 years of steep declines!), terrible recessions in Russia (ticker RSX -0.56% YTD), and troubles in Turkey (ticker TUR, -31.46% YTD), Saudi Arabia, and Kuwait, etc. Basically, OPEC is too productive. There could be nasty times ahead for the energy sector still (and for OPEC nations), even after 18 months of steep declines in oil prices (coming off of 104 per barrel in 2014, to the current 37.04 (for WTI; and 37.28 for Brent) [oil prices retrieved from here, oil-price.net] per barrel on December 31, 2015). Oil peaked in July of 2008 at just over $145 per barrel [click here for that chart], so its been declining for eight years now. There could be easily be consolidation, further layoffs, the slashing of dividends across the board, many bankruptcies, and general doom and gloom for the entire energy sector. In addition to a very weak energy sector, joining in on the way down, and putting negative pressure on the S&P500 was its sectors including basic materials (XLB), utilities (XLU), and industrials (XLI). Despite lower oil prices, the Dow Jones Transportation index finished down by -17.85% YTD (ticker IYT finished 2015 down by -16.85%).
In addition to ticker EWZ, there may be some great opportunities in the S&PLatinAmerica40 index, matched by ticker ILF (-31.40% YTD). Additionally, I like to follow the performance of ticker IDV as well, “the International Select Dividend ETF” by Blackrock’s iShares, which posted losses of -10.92% in 2015; and IXG (-4.40% YTD) the iShares Global Financials ETF; and ticker EUFN (-4.99% YTD) the iShares MSCI Europe Financials ETF. Check them out!
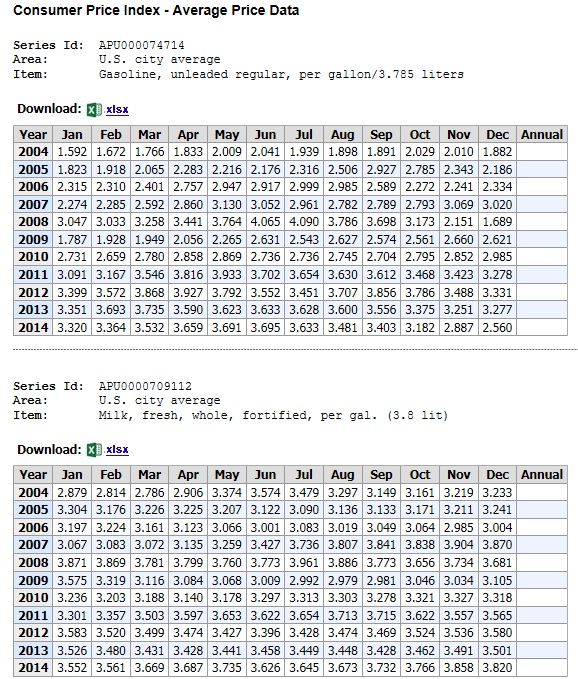
Somehow, I’m still bullish for 2016, as I see lower and low oil prices acting like a tax cut, which is good for consumer sentiment and consumer spending. Low and lower oil is great for the U.S. economy. Also, the entire energy sector represents only 2.59 to roughly 6.5% of all the U.S. broad based stock indices (just 3.03% of the S&PMidCap400, matched by ticker MDY and IJH).
Sometimes I wonder if too many believe that the USA is a very very oil intensive nation. We’re not, and we’re certainly not Kuwait, Saudi Arabia, Russia, or Brazil. I also worry that a lot of the selling “of everything” indiscriminately on low and lower oil (which is the trading action we’ve seen lately) is program trading, or algorithmic trading, or high frequency trading, and if so, eventually, they’re going to have to re-program their machines to interpret low and lower oil prices as beneficial and bullish for the USA and its stock markets, and inflationary outlook, and thus for fixed income prices and yields. Low and lower oil only hurts two things, (1) the energy sector, and (2) OPEC nations; It is absolutely fantastic for everyone else.
To me, I can’t figure out why so many are so foolishly bearish at this juncture, at mid-cycle, after the first rate hike off of zero interest rate policy. There is no nasty boogey man looming for the markets, in 2016 in my view. Instead, the market could really boogey woogey higher in 2016! I believe 2015’s performance was a little crummy due to that I describe as “a hang over” from 2013’s unusually strong performance, where many of the U.S. broad based indices rose over +30.00%. In 2013 e.g. the S&PMidCap400 rose by +31.57%, and the S&P500 rose by +29.60% (the S&P500 can be matched using the ETF ticker SPY), and the DJIA (matched by the ETF ticker DIA) rose by +26.50% in 2013. To me, it’s a shame that 2013’s thirty percent gain couldn’t have been spread out more evenly over the course of three years, in ’13, ’14, and ’15, everyone likes consistency.
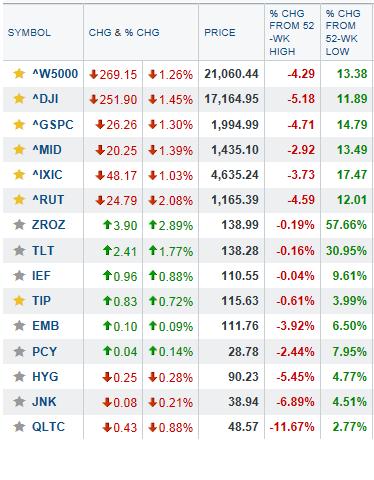
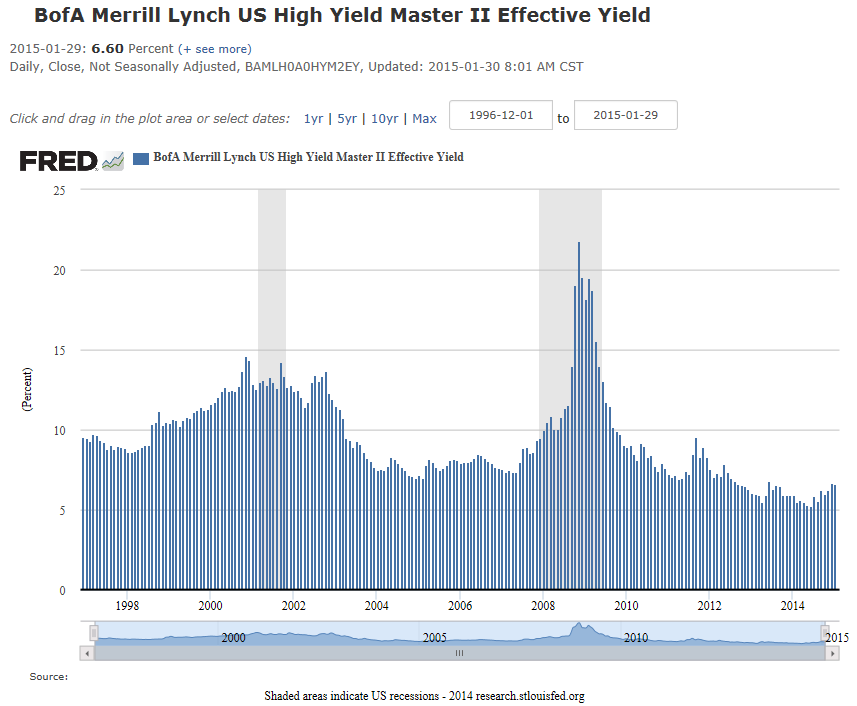
High yield U.S. corporate junk bonds (and their indices, matched by the ETF tickers HYG (-5.54% YTD), and JNK) also didn’t do too well in 2015, they’re both down nearly five and a half percent, including their streaming income… on a price performance basis, they’re both down nearly ten percent); It has been odd in the sense that there is no recession in the USA, yet the junk bond market has posted a negative return. The negative sentiment about the energy sector’s fixed income has led to losses in high yield. Some are worried about many energy sector bankruptcies.
Personally, in the high yield junk bond sector, I like sovereign U.S. dollar denominated high yield junk fixed income, as is indexed by the JPM EMBI, matched by ETF tickers PCY and EMB. Click here for Payden & Rygel’s analysis on the JPM EMBI for this week. There is also the JPM EMBI Local Currency Bond Index, I really don’t recommend this foreign currency (aka “local currency”) denominated bond index. King dollar is back!
The markets in 2015 were also worried about slowing China (see tickers FXI -11.91% YTD, ASHR, ASHS, HAO -2.05% YTD, PEK -1.20% YTD), slow Europe (EFA -0.90% YTD), Greece (GREK -39.95% YTD) and its debt crisis, Puerto Rico’s debt debacle, and rising rates in the USA off of its zero interest rate policy (ZIRP), while the rest of the world has been and still is in rate reduction and stimulus mode. None of this was a surprise however, and many have been talking about these issues for years. China could also prove to surprise to the upside, and not slow as much as is widely believed. Additionally, there’s been worries about global and domestic terrorism, after the tragic events in Paris and California. I believe there is a terrorism discount weighing on the markets right now. Lastly, there could be worries about the political risks in the U.S. since 2016 is an election year, in what appears to be “the Donald” versus “Hill & Bill” (or really just Hillary). The republicans can’t seem to coalesce around any of their numerous candidates running for president; and the democrats apparently only have leadership from solely one candidate, Hillary.
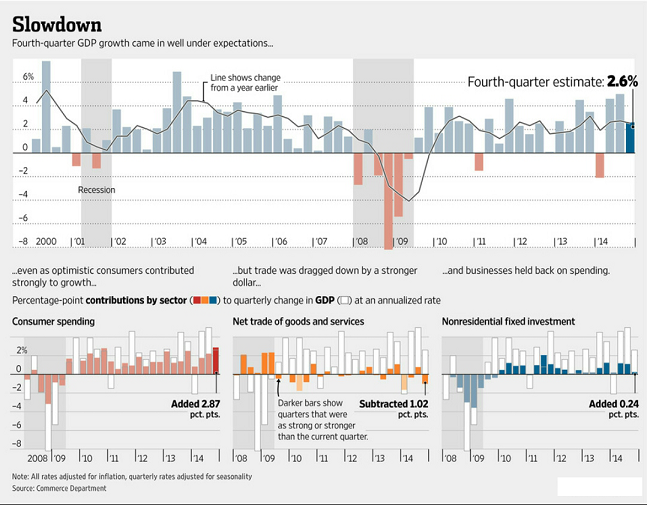
In the USA, GDP is expected to expand at a faster pace next year, from approximately 2.50% in 2015, to roughly +2.7% to 2.8% in 2016. Inflation is expected to creep up, but remain low, maybe going from roughly 0.00% to 0.30% to roughly 1.50% to 1.75% percent in 2016. Additionally, I believe and expect the real estate markets in the U.S. will strengthen, and the U.S. labor market will strengthen as well. Interest rates are expected in the USA to go from 0.25% percent, to roughly 1.25% at the short end. On December 31, 2015 the 30 Year Treasury Bond yield currently rests at 3.02%, the 10 Year Note Yield rests at 2.27%, the Five Year Note closed at 1.76%, and the 13 week T-Bill Yield rests at 0.15%. I expect the yield curve to flatten slightly, but remain steep, as all rates should creep up a bit. Maybe the 30 year bond yield will increase 75 basis points in 2016, while the short end rises 100 basis points. We shall see. Globally, GDP is expected to grow worldwide, at roughly +3%. China is expecting roughly 6 to 7 percent GDP growth, S.E. Asia expects to see +4% growth. Even Europe is expecting to grow in 2016, at a faster pace than 2015’s sluggish growth.
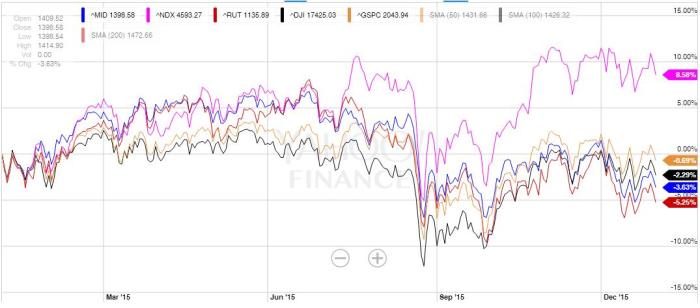
In the charts above I have charted the 12 month performance of the broad based U.S. stock indices (chart #1).
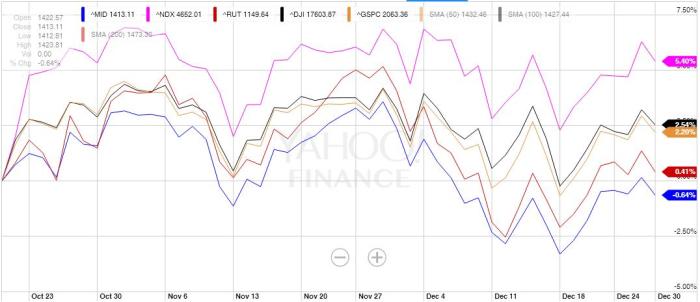
Also above (in Chart #2), I have charted October 21, 2015 through December 31, 2015, because usually, October 21st through February 19th of the next year is a great time for equity investors. Normally, we see seasonal strength in the stock indices between October 21st and February 19th of the following year. I’ve done research on this and have determined it’s usually because of and due to increases in consumer spending (primarily holiday and travel expenditures), seasonally strong 4th quarter EPS of all the components of the broad based indices, mutual fund window dressing, the Santa Claus Rally, the January Effect, Congress being out of session, new government spending proposals, abatement of tax loss selling, and 401k and IRA contributions, etc. There are many reasons for the markets to do well at year end, and into the new year. This year’s year-end-rally hasn’t been that great, so far (except for Biotech, see ticker IBB, from October 21st through December 31, 2015) Click here for ticker IBB’s main components. Now, it’s never over until the fat lady sings! And it’s not February 19th of 2016 yet. But so far, performance hasn’t been that great. Regardless, I’m bullish going forward, full steam ahead. I firmly believe that if there is no recession looming, then there will be no bear market. And I firmly believe that there will be no materialization of any recession in 2016, or even early 2017.
2015 also saw some fantastic “blow ups,” including tickers FXCM, MNK, CMG, and VRX (click here for quotes on these). Bottom fishers might want to speculate in these, with high risk funds. Click here, for list of potential bottom fishing candidates; Know that it can always “get worse” before it “gets better!”
Within the energy sector are also many many stocks that have absolutely stunningly declined substantially off their mid 2014 highs. There’s plenty to choose from if you dig around a little, which could satisfy the bottom fisher’s quest for the rebound.
Also, BitCoin (click here for the wiki article), was listed in 2015 somehow as a commodity! GBTC is managed by a company called Grayscale, a Digital Currency Group Company. Click here for the commodity wiki article. I like to say the so-called BitCoin crypto-currency (whatever that means!) is like the board game Monopoly, and its Monopoly Money (backed by absolutely nothing!!! HA!!!). I suppose even Monopoly money is worth something, like maybe the paper its printed on. This BitCoin BS is the ultimate BS hype bubble right now, and it’s inflating very very rapidly! See ticker GBTC, it should prove to be highly amusing. Speculative asset bubbles are fun while they’re inflating, but they’re no fun at all when they go pop for those speculating in them! So, BE CAREFUL if you play with fire! I like to say it’s currently appreciating due to the greater fool theory, or kinda like hot potato. Bubbles to me are also like musical chairs, and at some point the music will end, and the bubble speculators will be left without at place to sit. Click here for the wiki article on bubbles.

Bubbles can inflate rapidly, but they can also pop, and suddenly burst; Stunningly devastating losses can mount up and materialize. Investors might be better off investing in literally trash versus BitCoin (ticker GBTC). Try what I describe as “The Four Kings of Trash,” Waste Management, Waste Connections, Republic Services, and Covanta, tickers WM, WCN, RSG, and CVA.
This BitCoin (ticker GBTC) mania and euphoria reminds me when the ETF ticker GLD first became listed on the exchanges. GLD (in my opinion) attracted so much money out of the securities markets (after it was listed as an ETF for securities investors for the first time) that it created a bubble in gold, which inflated, over the course of seven years, by roughly +311% gain (from 45 to 185), before popping and imploding. Today, I believe GLD is still in the process of popping (in my view), and has come back down to 101.46, as of 12-31-2015 (from the roughly 185 peak in July of 2007). I do not think gold (or the ETF ticker GLD) will see its prior peak for a very very long time.
I like to say: “Bubbles go Pop!“ If you’re interested in reading up on bubbles see the book, available at Amazon, by Daniel Gross: “Pop, Why Bubbles are Great for the Economy.” You may also be interested in “Extraordinary Popular Delusions and the Madness of Crowds,” and perhaps also “Manias, Panics, and Crashes.” Click here, for a historical long term list of recessions, depressions, and panics in the United States, on Wikipedia, which might also tickle your fancy.
I think commodities shouldn’t be listed on the securities exchanges. To me, commodities are not securities, and so they should not be listed on the AMEX, Nasdaq, NYSE, etc. for investors to trade like stocks. To me, commodities, belong at the NYMEX or Chicago Mercantile Exchange, and should solely be traded by commodities traders, in commodities accounts. I’m not sure why the CFTC, SEC, or the IRS has allowed the subversion of many commodities to be listed as ETFs on the securities exchanges for securities investors. Speaking of commodities gone wild, it looks to me like coffee, ETF ticker JO, is finally “on the move,” and 2016 could be the year of coffee bean prices!
Wrapping things up, I wanted to leave you all with a quote list of my favourite high yield stocks, in no particular order; Click here for that list.
Lets all hope that the god (or really goddess) of securities and investing, and of wealth, fortune, and prosperity, Lakshmi, brings better times ahead for investors!
Here are three great reports to assess the state of the economy: (1) Click here for the FOMC’s statements and minutes and estimates; (2) click here for the most recent edition of The Economic Indicators; and (3) click here for JPM Asset Management’s “Guide to the Markets” publication and analysis.
Lastly, here’s the current assessment of the U.S. Economy and its markets by Deutsche Asset & Wealth Management [click here for their current report].
Happy Trading!,
Andrew G. Bernhardt
PS- Here’s a great resource on (1) how all iShares are doing, click here; Also (2) here’s how all SPDR ETFs are doing, click here.
[Click here for my comments on the business & economic news daily]