October 2, 2017- MARKET CHECKUP – End of 3rd Quarter

Monday, October 2, 2017

(Before market open)

End of the 3rd Quarter

Market Checkup

9.31.17 All US Indices.png

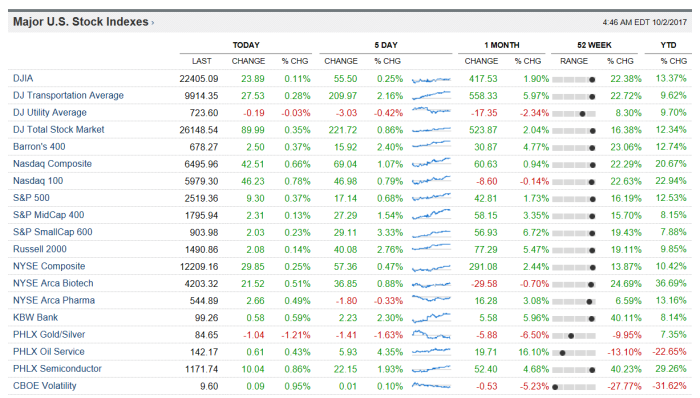
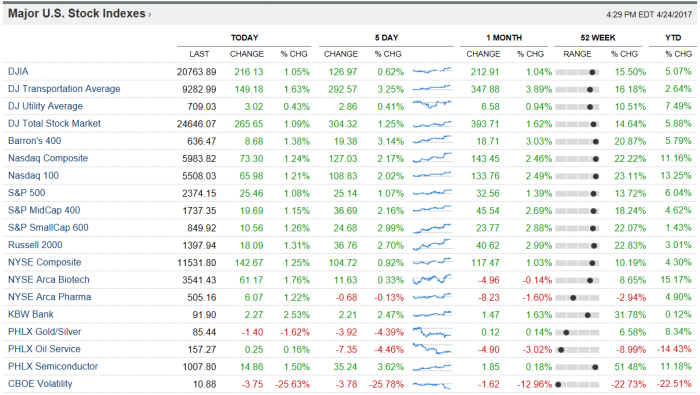
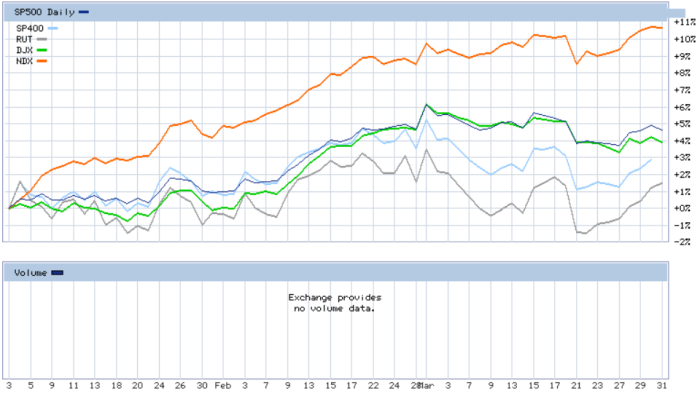
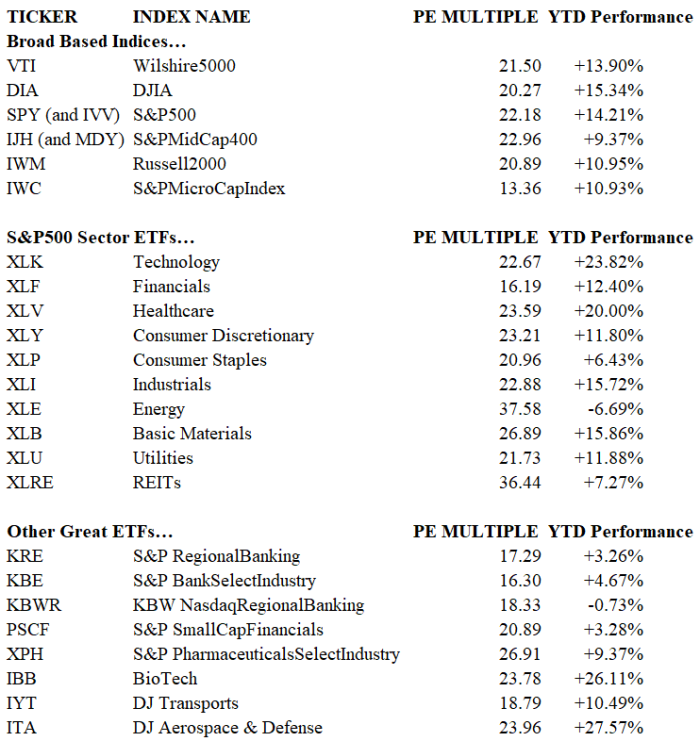
It’s the end of the 3rd Quarter and the year 2017 so far has flown by fast!  Despite many risks, the broad based U.S. stock indices have increased nicely.  [According to the WSJ’s statistics above] The DJIA +13.37% YTD (matched by ticker DIA), the DJ Transports +9.62% YTD (matched by ticker IYT), The S&P500 +12.53% YTD (matched by ticker SPY), the S&PMidCap400 +8.15% YTD (matched by ticker IJH), the Russell2000 +9.85% YTD (matched by ticker IWM).  Tech (despite being a four letter word) has increased by +22.94% YTD as measured by the Nasdaq100 (matched by ticker QQQ).  Additionally, the DJ Aerospace & Defense Index has risen by +27.57% (matched by ticker ITA).  In the fixed income arena, the JPM EMBI (matched by ticker EMB), a fixed income index of sovereign high yield has (according to the EMB website) increased by +8.78% YTDU.S. Corporate high yield junk bills as matched by ticker SHYG is +5.16% YTD (according to the SHYG website).

9.31.17 Treasury Rates B.DS.

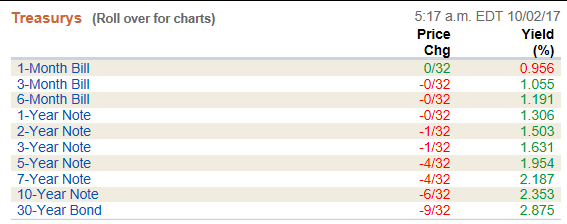
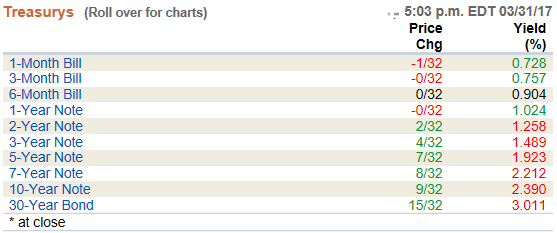
Treasury rates (see above image) are still, as I like to say, “supid low.”  Who would lend money to anyone (including to the U.S. Government) at these rates?!  To me anyone that buys Treasury Securities is ripping themselves off;  Then again rates are negative in Japan, Germany, Italy, Spain, and elsewhere, so any positive yield might look great to foreigners.  The 3 month T-Bill yields 1.055%, and the 2 year Note yields +1.503%, and the 10 year Note yields 2.353%, and the 30 year Bond yields 2.875%.  What a joke Treasury yields are!  To me serious fixed income investors invest in the following tickers EMB, PCY, SHYG, and SJNK.

9.31.17 Fixed Income Data

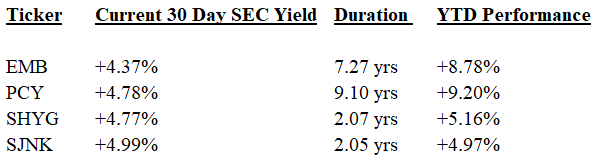
As you can see, the current 30 day SEC yield of EMB (which is sovereign high yield) is 4.37%, and the ETF has a duration of 7.27 years, and [according to the ETF’s website] is +8.78% YTD.  PCY has a 30 day SEC yield of 4.78%, a duration of 9.10 years, and YTD is +9.20%.  SHYG (which is U.S. corporate high yield junk fixed income) has a current 30 day SEC yield of 4.77%, a duration of 2.07 years, and YTD is +5.16%.  SJNK has a current 30 day SEC yield of 4.99%, a duration of 2.05 years, and YTD is +4.97%.  To me, SJNK seems most appealing (in fixed income) because the current 30 day SEC yield is +4.99% and yet the duration is also really low at 2.05 years.

Lets review some risks for investors going forward.

  1. Janet Yellen’s term at the Federal Reserve ends on February 3rd, 2018, and usually if any Chairman (or Chairwoman) steps down, there is a mini-scare and mini-panic, and a correction materializes in the stock markets, as anxiety creeps into the psyche of investors.  Perhaps, they’re worried about getting a weirdo like Paul Volcker, who in July of 1981 raised short term interest rates to 14.00% (See a historical chart of the Fed Funds Rate Here).  There is speculation that our current Treasury Secretary Steve Mnuchin will be nominated by President Trump to take Yellen’s place.
  2. Interest Rates are on the rise (see this chart) as set by the Federal Reserve.  If they are perceived to get too aggressive with rate increases, a recession could materialize, bringing with it a pull-back, a correction, and a bear market for stock holders worldwide (including the USA).  Beware of an overly aggressive Fed.  Higher rates will also spell TROUBLE for fixed income, so reduce your durations to mitigate risk, if you trade fixed income (e.g. you don’t want to be in 30 year zero coupon Treasuries while rates rise).  So, SHYG or SJNK looks better to me versus e.g. ZROZ or TLT.  For maximum price stability (and for maximum reduction of risk) try tickers SHY (a 1 to 3 years to maturity Treasury Bill Index ETF) and IEF (a 7-10 year Treasury Note Index ETF).
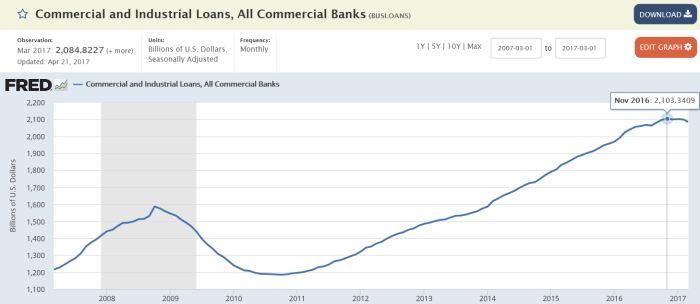
  3. Higher interest rates will also affect auto loans, home loans (and mortgages), housing prices, educational loans, credit card spending, and other spending habits of approximately 320 million people in the USA, and the remainder of 7.2 billion people on earth.  Less borrowing and spending by Americans will turn into less income for everyone (watch total commercial & industrial loans in the data and on charts here).
  4. In addition to rising interest rates the Federal Reserve and the U.S. Treasury have decided to “wind down” TARP and sell their accumulated $4.5 trillion dollars of fixed income securities.  This selling pressure of $4.5 trillion of fixed income securities will put upward pressure on interest rates across the entire yield curve.  They say they’ll sell them off (“quietly in the background”) at approximately $10 billion dollars per month, escalating to $50 billion dollars per month.  No one likes higher interest rates, as everyone (the U.S. Government included) appears to be a net borrower, not a net creditor or net lender.
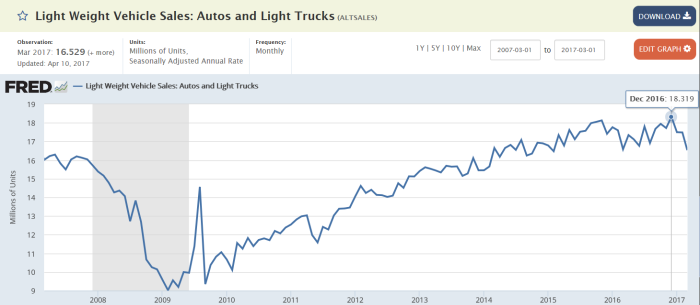
  5. The Hurricanes is likely to impact GDP and GDP Growth of the USA negatively (at first), while in 2018 the rebuild efforts which will materialize for Texas, Florida, Puerto Rico, and the U.S. Virgin Islands is likely to bolster GDP and GDP Growth.  However the losses of economic activity in e.g. Corpus Christi, Miami, San Juan, Charlotte Amalie may not ever be replaced.  The hurricanes which have devastated these cities will also likely impact our nation’s car sales figures positively, and could materialize into boons for Home Depot, Lowe’s, Ford, General Motors, and home builders (see ticker ITB), while being a negative drag to nearly everything else.  The hurricanes will also likely increase (negatively) initial claims and also unemployment figures.
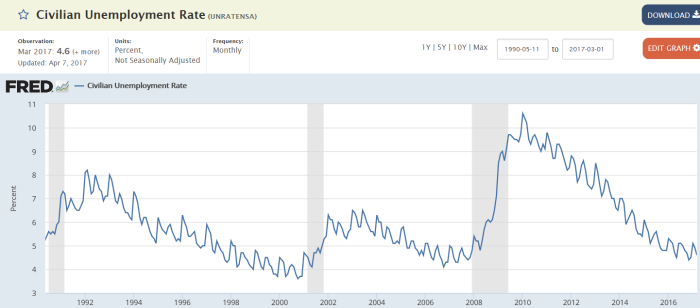
  6. Watch the hurricanes have impacts on the data & charts here:  On GDP, Unemployment (beware of rising unemployment, which was already off its low-  Further increases in unemployment could signal the end of the current economic boom cycle, this is very very serious), Total Vehicle Sales (vehicle sales were beginning to decline, but I have confidence that after these hurricanes, the figures could begin to improve again).
  7. There are also risks of “rocket man” (otherwise known as the leader of North Korea) and his obsession with terrorizing the world with his nuclear weapons testing, rocket testing, and other egregious actions with his military.  Lately, he likes to fire ICBM tests over the land belonging to Japan, which is very worrisome, especially if there was some sort of malfunction during the test, resulting in the missile landing on Japanese soil, rather than out in the ocean somewhere.  War mongering and fear mongering is a real risk, which has been fueling the Aerospace and Defense industry (e.g. ticker BA, Boeing, is up over sixty-three percent this year- See YTD data on the DJIA components here).  Fear mongering and war mongering could also lead to higher oil prices, which could rise if a war breaks out anywhere worldwide (click here for a crude chart currently at $50.84; click here for a brent crude oil chart currently at $56.05).  Then there’s always the possibility of further invasions of Iraq, Afghanistan, Syria, and elsewhere (for some reason Trump even mentioned the possibility of invading Venezuela, although I’m not sure if it would be for humanitarian purposes or otherwise).
  8. As previously mentioned, beware of unemployment rising, (and beware of declining labor force participation rates) as it could signal the end of the current economic boom cycle.  It appears as though the unemployment rate struck rock bottom this April at 4.10%, and it has currently already crept up to 4.50% (through August).  The current expansionary boom cycle started in March of 2009, and this cycle is nearly the oldest boom cycle on record for the USA (in other words the current boom cycle has been one of the longest lasting expansionary boom cycles).  Once the party is over in the USA (since we’re a huge part of the world’s GDP), a pull back, correction, and bear market in stock indices worldwide will likely result; and a recession could materialize, which will likely discourage investors and demoralize people worldwide.  So be careful.  Once the stock indices are down by twenty-five to thirty percent, in a recession and bear market, you might want to consider increasing exposure to the stock indices, as rebounds generally rally through prior all time highs, and the rally could last years.
  9. The total Federal Government Debt Outstanding is over twenty trillion U.S. Dollars (see the Treasury’s website on the debt to the penny here), and is currently $20,203,668,853,807.76 (as reported 9-28-2017).  When we will ever have a responsible President and Congress is anyone’s best guess.  But the USA is not sustainable with trillion dollar deficits annually, or half a trillion dollar deficits annually.  They need to control their spending and appropriations, and they need to put an effort into balancing the budget, and then in running a surplus.  Otherwise, eventually, there could be a currency crisis, and a total default crisis in the USA, and a total economic collapse and catastrophe in the USA.  Surely, the U.S. Congress will love to blame banks (and the whole financial sector of the economy), hedge fund managers, investors, and risk takers, but it is really them who are playing “Russian roulette” with our future and the economy.  Borrowing excessively, crowds out borrowing, crowds out investment, and incites a credit crunch.  Surely, the U.S. Congress will also pretend in the future, during the next crisis, that more regulations and more laws are the solution; But recessions can not be outlawed or prohibited.  Their idiocy will surely be amusing and pathetic, it always is- So stay tuned!  The irresponsible fools of our U.S. Congress (who I like to say are incompetent, illiterate, ignorant, and who can’t count) authorized the borrowing of literally $317,589,836,297.00 between literally just September 7th and September 8th of 2017.  Yes, literally, over three-hundred-and-seventeen-billion-five-hundred-and-eighty-nine million dollars in just one 24 hour period.  What clowns.  Are they trying to incite a credit crunch and total default?!  (Click here for data on the deficit or surplus of the USA).  Recently, the Total Federal Government Debt Outstanding now exceeds the USA’s annual GDP (this is known as the Debt to GDP ratio).
  10. Many say that gridlock is bad in Washington, DC, but I’ve noticed that a “do nothing” Congress has been great for the economy and the markets over the past nine to ten months (and before in the past).  Besides, when was the last time the Congress did anything that everyone liked.  Gridlock is good.  Didn’t Gideon J. Tucker say “no man’s life, liberty, or property are safe while the Legislature is in session.”  So, will we get less regulation (or deregulation) of financials?  Will the U.S. Congress get some tax reform through?  We shall see.
  11. Consumer confidence, consumer spending, and consumer sentiment are at nearly all time highs.  Can it really get any better from here, or is this as good as it gets, as I have written about in prior blog posts (click here for that).
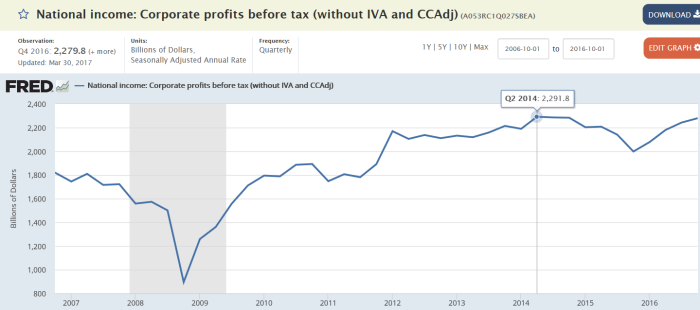
  12. Watch corporate profits before tax (click here), currently at 2,254.30 in Q2 of 2017, which have yet to eclipse the peak from Q4 of 2014 of 2,292.50.  This is not a typo, corporate earnings are down, and yet the markets are up strongly since Q4 of 2014, eventually “something has got to give,” as they say.  Going forward, we don’t want to see these figures stall out and begin a decline. Rising profits (and steady or improving labor force figures) will be required to take the stock indices to a higher level.
  13. The volatility index, the VIX is very very low right now at 9.53A VIX this low may be an indication of euphoria and complacencyWhen the VIX rises, the broad based stock indices will decline (especially the S&P500, which the VIX is directly associated with).
  14. A disintegration of the Eurozone (EZ) and the European Union (EU).  Last year the UK voted to “BrExit,” or leave the EU and the EZ, although it wasn’t a full member (and I have doubts that the UK will ever actually leave).  Catalonia (in the North East of Spain) has voted to leave Spain.  Greece wants to leave the EU and the EZ.  Germany has even said it wants out of the EU and EZ.  This is a disaster just waiting to happen.
  15. There may be a looming banking crisis in Italy (and elsewhere in Europe), where many banks are becoming more and more insolvent because they’ve made too many non-performing loans (see this article).  Estimates of troubled loans in Italy top the equivalent of $400 billion dollars (20% of all their loans).  One of the world’s oldest and finest banks just might go bankrupt, Monte dei Paschi (see this article).  An Italian banking crisis will be much more significant and devastating than any crisis in Portugal or Greece, as its economy is much larger.

In the meantime enjoy the U.S. stock indices while they are at all time highs (see Miley Cyrus on YouTube “Party in the USA”).

Currently, I like financials (see XLF, KBE, KRE, KBWR, and PSCF), as many believe that higher interest rates will benefit the financials (how rising rates benefit anyone or anything though is really anyone’s best guess- but this is a very widely held belief among investors).  Also, with the 2017 resurgence of the healthcare sector (see tickers XLV, IBB, XBI, and XPH) I am starting to like XPH again, as it is lagging XLV and IBB YTD.

Long term though I really like the S&PMidCap400 (matched by ticker IJH); because mid caps tend to grow their EPS and Revenue at a faster pace and at a more consistent rate over time than (e.g. S&P500 see ticker SPY) large caps (and also when compared to (Russell2000 see ticker IWM) small caps).  Higher and more consistent EPS and Revenue growth (of mid caps versus large and small caps) shows up in stock price performance.  See the relative outperformance of ticker IJH (the S&PMidCap400) versus e.g. SPY (the S&P500) and IWM (the Russell2000) over nearly every three, five, and ten (or greater) year period.  The S&PMidCap400 also is great to me because it avoids the hyped up large cap tech sector, laden with over valued stocks such as Netflix (which currently has a PE multiple of 220.62, according to Yahoo Finance), and Amazon (which currently has a PE multiple of 244.49 according to Yahoo Finance), and of Tesla (which has no earnings, and losses more and more with every electric car sale made).

Summing things up, I wanted to give you the current PE Multiples and YTD data on many widely followed ETFs.

9.31.17 ETF PE & YTD Data

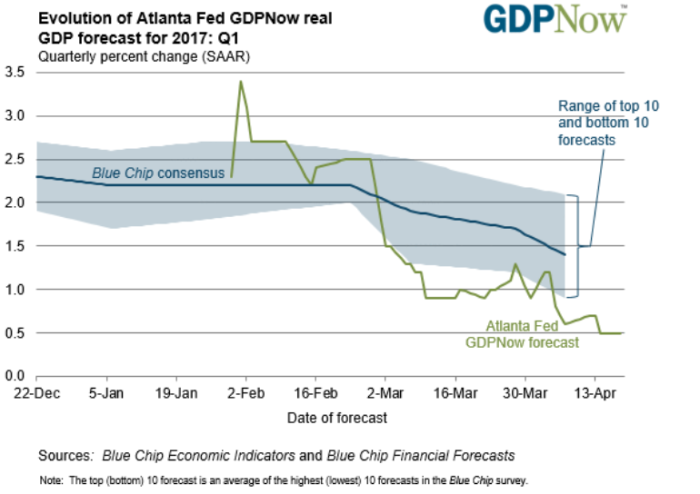
Lastly, checkout these links & resources to determine how the economy and markets of the USA (and of the world) are doing:  The Federal Reserve’s Statement, Implementation Note, and Projection Materials (click here if you’d like to watch their last press conference); Kiplinger’s Economic Forecasts; The Economic Indicators (August 2017); JPM-AM “Guide To The Markets”; Atlanta Fed GDP Now; FRED TED Spread Data & Charting (lower figures are better); and CNN’s Fear & Greed Index.

Happy Trading!,

Andrew G. Bernhardt

PS-  Be sure to checkout my Great Useful Links Page; Great News Sources; and Click here to see which Economic and Business related news articles caught my eye daily which I post on Google+.

PPS-  As always, this blog is free of charge, and is for educational and for informational purposes, and is not securities advice (see my disclaimer for further details).

April 24, 2017 – MARKET CHECKUP – “Is This As Good As It Gets?”

SECURITIES MARKET CHECKUP

IS THIS AS GOOD AS IT GETS?!”

Monday, April 24, 2017 (3:29pmCT)

4.24.17 All US Indices Perf

[Caption: 2017 Has been good for the US indices, its broad based indices are currently up by +3.01% to +6.04% YTD, and they are all -1.31% to -1.45% off their all time highs.]

The markets have been rallying since about March 10, 2009.  Bull markets and a booming and bustling economic cycle unfortunately cannot last forever.  Below are reasons to be cautious.  I have pulled a lot of data from FRED (the Federal Reserve Economic Data Research Website), which is free, and I have provided the links to the data.  You can find more FRED links (and other great links) at my Great Links Page as well.

REASONS TO BE CAUTIOUS:

1. Unemployment can not really get any better from here (see chart below).  In other words, we’re at maximum or peak employment, and it can only get worse.  When it does, rest assured that investors will panic out of equities.  Below I have displayed the unemployment rate over the past three recessions (displayed in gray) and the booms afterwards resulting in lower unemployment rates.  Notice unemployment rates don’t have to increase by much before stock investors panic, bringing about pull backs, corrections, and bear markets, heading into recessions.  The current unemployment rate is 4.60% which is over the low of 4.40% in November of 2016.  [See the data from here https://fred.stlouisfed.org/series/UNRATENSA ]

4.24.17 Unemployment

2. We’re at “peak autos,” as in peak auto sales (see below).  Many are saying that the auto sector can’t keep selling cars and trucks at the pace it has been in the recent past, and that things can only get worse.  Peak auto sales were in December of 2016 at 18.319 million units sold, today the print is just 16.529 million.  Sales are beginning to decline. [See the data from here https://fred.stlouisfed.org/series/ALTSALES ]

4.24.17 Auto Sales

3. Total Commercial and Industrial Loans (see below) from banks peaked recently in November of 2016 at 2,103.3409, and are in decline, to the current level of 2,084.8227.  Basically, it appears as though financial institutions are not lending out money any more (or customers are no longer interested, thanks to higher rates, or their perception of a bleak future).  Loans are simply being repaid, and new loan originations have halted.  Banks are apparently less eager to take risks lending money.  This could be what’s behind “peak autos,” perhaps they won’t make Subprime or Alt-A auto loans anymore?  Later the banks could halt other kinds of loans.  This could result in less money being spent by consumers, as people seemingly only slosh around borrowed money from themselves to each other.  With less lending from banks made to their customers, people can’t spend as much as before.  Less spending means less earnings, less revenue, and less income for businesses; once this becomes readily apparent, layoffs will be made, and unemployment will rise.  This to me is very scary! “Credit makes the world go ’round.”  [See the data from here https://fred.stlouisfed.org/series/BUSLOANS ]4.24.17 Comm & Indus Loans.png

4. Capacity Utilization is declining (see below).  Apparently factory orders are not booming, and our nation’s industrials and manufacturing plants are sitting around “doing nothing.”  Capacity Utilization peaked in November of 2014 at 79.20%, and has gone down to the current level of 76.10%, although it is off recent lows as well. [Get the data here https://fred.stlouisfed.org/series/TCU ]

4.24.17 Capacity Utilization

5. GDP Growth in the USA is very very low.  Could it go lower?  Sure.  Especially with banks lending out less and less money to customers.  The Atlanta Fed’s GDP estimates (see the green line in the chart below) put U.S. GDP Growth at just 0.50%, below the previous blue chip estimates (which have also been in decline, see the blue line in the chart below).  It, unfortunately, appears as though both the Blue Chip Consensus and the Atlanta Fed’s estimates indicate decelerating GDP Growth.  This does not bode well for the future. [See the data here https://www.frbatlanta.org/cqer/research/gdpnow.aspx?panel=1 ]

4.24.17 Atlanta Fed GDP Est.

HERE ARE SOME MORE REASONS TO BE CAUTOUS GOING FORWARD:

  1. War mongering and fear mongering of the media regarding Syria, Afghanistan, and North Korea.  When was the last time a republican administration did not start a war?  With war mongering on the rise, if you’re looking for a war-proof portfolio, a terrorism-proof portfolio, and bullet-proof earnings growth, take a look at ticker ITA (an iShares ETF) matching the performance of the DJ U.S. Aerospace & Defense Index (or hand pick its components).  I like to say its components have bullet proof earnings because the Congress wouldn’t dare reduce the defense budget.  It’s main holdings include tickers BA, UTX, LMT, GD, RTN, NOC, COL, TXT, and CW, RGR, AOBC, etc. (although not necessarily in this order).  Click here for charts on all these defense contractors
  2. Higher oil prices could be coming.  After all peak fuel prices were in 2007 to 2008 with light sweet crude oil at $147 per barrel.  Oil is a scarce limited natural resource, which we are depleting, so it should be moving higher as we get closer to ultimately running completely out of oil someday.  If a war breaks out, there will be a war time premium placed on oil prices. Today crude oil finished at about $49.21 per barrel.(http://quotes.wsj.com/futures/CRUDE%20OIL%20-%20ELECTRONIC).
  3. North Korea’s goal of conducting nuclear weapons tests.  This scares equity investors and everyone world wide.
  4. The French Election.  Will they really elect Macron, who is thirty-something years old?!  He looks 25!  Le Pen could win on May 7, 2017, and she will pull France out of the Euro Zone, out of the Euro Union, and out of the Euro Currency; she will also restrict immigration policies of France.  This will be much more significant than BrExit, as FrExit entails a full member leaving the EZ, EU, and Euro currency.  The UK was a half member, and the markets freaked out when it left.  France is a full member.  Buyer beware.  I think if France leaves the EU, the EZ, and the Euro Currency it will spark the total disintegration of the EU, EZ, and the euro currency itself- because other EU members will also want to leave.
  5. The Federal Government is getting close to eclipsing $20-Trillion-Dollars of Federal Government Debt Outstanding. (Click here for US Debt to the Penny)  This debt excludes state, county, municipal, metropolitan, city, and local debt; It excludes corporate, agency, public company, and private sector debt too.  We’re buried under a mountain of debt.  Very high debt is the reason the USA has such low GDP Growth anymore.  The Congress cannot keep on running $500-billion to $2-trillion dollar deficits annually.  It’s completely unsustainable and will result ultimately in (A) a total economic collapse and catastrophe of the U.S. financial system, and (B) a total default, if the legislature can’t balance the budget, or better yet, run a surplus. When is enough enough?  Will there eventually be a debt and currency crisis in the USA?  The Congress will have to place greater emphasis on balancing the budget or on running a surplus, or the USA will not be sustainable. (Click here for USA Deficit Data)
  6. A potential looming wind down of TARP (the troubled asset relief program).  The U.S. Treasury and The Federal Reserve wants to sell all the assets it bought during the financial crisis.  It’s current list of assets is over four trillion dollars of securities (mostly fixed income).  Selling fixed income in massive quantities could result in higher interest rates.
  7. Gridlock in DC.  We’ve got a do nothing Congress.  They can’t seem to make progress on anything, including ACA Reform, Tax reform, on Repatriation of Foreign Earned Income abroad, etc.  Will the republicans in both houses of Congress be able to pass anything, or will the President just manage everything with executive orders and guidelines (like Obama did).
  8. There is lots of hoopla on investing in risky foreign market ETFs lately (see my list of foreign ETFs here).  Interest in all these foreign markets might be signaling a peak in the international (and domestic) markets.
  9. Record Margin debt has been amassed by investors.  This means that investors are buying stocks and leveraging them further on borrowed funds.  Investors have very high and elevated expectations going forward.  Could upsets be looming sparking massive sell offs?  Could record margin debt be signaling a peak in the global stock indices?
  10. Consumer sentiment, consumer confidence, and consumer spending are all at nearly all time highs.  Is this also as good as it gets?  The consumer is the biggest driver of GDP and of GDP Growth.
  11. A flood of IPOs has recently been carried out at the NYSE (see tickers SNAP, GOOS, MULE, CADE, YEXT, etc.); Surely, most of these will turn into total flops and their prices will be entertaining to observe.  Is this a signal of the market over heating as well?
  12. A looming potential Federal Government shut down, perhaps by the end of April, 2017.
  13. Janet Yellen’s term as Fed President ends February 3, 2018.  Every time a Fed President steps down, there seems to be a stock market correction and miniature panic.  Remember what happened when Greenspan and Bernanke left?
  14. Another scary concept is that the Federal Reserve is raising rates towards “normalization.”  There will be no more 0.00% to 0.50% Fed Funds (click here for Fed Funds Discount Rate Data).  The Federal Reserve is notorious for raising rates by too much, or too fast, making pundits and gurus everywhere claim they are being “too aggressive.”  This could easily halt more consumer spending, as consumers watch the rates at which they can borrow, and they adjust their spending accordingly.  Rising rates has an impact on consumers dealing with mortgages and home purchases (as well as refinancing), it also has an impact on car loans and the rates they will accept, and even on credit card spending, and educational loans.  Higher rates are no good for anyone (not for the Government which borrows like there’s no tomorrow, and it’s not good for consumers either).  I’d estimate the Fed will raise rates until the markets and the economy really cools off.  Once they’ve discovered they’ve wrecked the economy, they will quickly begin to lower rates.  REST ASSURED, IT WILL BE A FIASCO.  Take advantage of the economic cycle.  Once the Fed has destroyed GDP Growth, causing a recession in the economy, and wrecking stock prices, buy more stocks (because they will likely be thirty percent off their all time highs, and they will likely rebound during the next boom of the economic cycle).  I think a recession could come in 2018 or 2019, and the stock markets will decline substantially in advance of the recession.  I like to say the time to be most bullish, is when the front page of the Wall Street Journal says something along the lines of “it’s official, there’s a recession in the USA.”  I believe in the USA that the stock markets are likely to hit a low, once a recession is declared, and that this will present a major buying opportunity!!!  Baron Rothschild said “the time to buy is when there’s blood in the streets.”

FOR ALL THESE REASONS IT MIGHT BE TIME TO DELEVERAGE AND TO BE CAUTIOUSCheckout tickers PCY, EMB, SHYG, and SJNK.

LASTLY, I WILL LEAVE YOU WITH ONE REASON TO BE OPTIMISTIC (which I believe everyone is hanging onto).  Corporate Profits before Tax (see chart below) are back on the rise, after peaking in Q2 of 2014 at 2,291.80 (yes, really, just about three years ago).  Current levels (Q4 2016) are 2,279.80, and appear to be increasing again (after striking a low in Q4 of 2015).  If earnings can increase going forward, and break into new highs, this will support stock prices, likely propelling them higher.  Beware of extremely elevated and high expectations for earnings going forward, disappointments could easily materialize. (Get the data here https://fred.stlouisfed.org/series/A053RC1Q027SBEA )

4.24.17 Corporate Profits Before Tax.png

Happy Trading!,

Andrew G. Bernhardt

March 31, 2017 – MARKET CHECKUP

SECURITIES MARKET CHECKUP

March 31, 2017

(All data after the close)

3.31.17 All US Indices

This year has started off with a bang, to the upside.  Year to date, the DJIA (matched by ticker DIA) +4.56%, the Nasdaq100 (matched by ETF ticker QQQ) +11.77%, the S&P500 (matched by ticker SPY) +5.53%, the S&PMidCap400 (matched by tickers MDY & IJH; IJH is now cheaper, with a 0.07% annual management fee) +3.56%, and the Russell2000 (matched by ticker IWM) +2.12%.  Volatility has declined YTD, settling at 12.37 today, which historically is low.  I like the S&PMidCap400 best, and I would imagine that it will likely continue to outperform the other broad based indices going forward (compare the 52 week performance of the S&PMidCap400 to the S&P500), despite its performance YTD lagging the S&P500.  I’d base this estimate on the fact that EPS and Revenue growth is generally speaking much more consistent and higher for mid caps versus their large cap (and small cap) counterparts (which tend to trend more with the economic cycle).  So, MDY and IJH works for me.  The S&PMidCap400 also does not have the hyped-up BS baloney galore tech stocks with extreme valuations (aka very high PE Multiples, that is, if they have earnings) which will blow up when the next recession comes; And yes “tech” is forever a four letter word, ever since 3-10-2000 (because after the tech wreck of 2000 through 2002, it took literally until 2017 to get back to the highs of March 2000)I would say, do not be enticed into tech stocks or IPOs, instead laugh at the TSLA stocks of the world, being driven into bankruptcy by e.g. Elon Musk, who can’t even produce a single car profitably! Recent IPOs such as tickers SNAP, GOOS, and MULE are likely to turn out as total wrecks.  F and GM are much better companies and stocks (with great dividends) versus TSLA (with no dividend, and no earnings!).  The PE Multiples of e.g. NFLX and AMZN (and other tech stocks) are increasing like the altimeter of a launching space shuttle! Their meteoric rise is unsustainable. Triple digit PEs are nuts!

3.31.17 Treas Yields

Treasury yields are still “stupid low,” as I like to say.  The U.S. Government is running up on nearly $20 Trillion dollars of debt (click here for U.S. Debt to the Penny), and the Congress (who can’t count, probably because they’re drunk and on drugs) doesn’t want to appropriate funds for interest, so they keep rates artificially low.  Who would lend money to the Federal Government at these rates?!  Anyone who does, is ripping themselves off!  These rates (despite moving up recently) are still a total joke! Rates are so low that pensions are becoming insolvent, and retirement is a fairy tale, a fable, and pipe dream conceptualized during the roaring 1920’s and the roaring 1990’s.

Serious fixed income investors should checkout tickers EMB and PCY, which both pretty much match the performance of the JPM Emerging Market Bond Index, which is a category leader and winner, time and time again, in fixed income.


3-6-17 Multiple ETF & MF Past Perf
Multiple Calendar Year Total Returns for multiple ETFs & the Mutual Fund FNMIX; and their average returns, and standard deviations.


Above is data on the total returns by ticker for many ETFs and one mutual fund ticker FNMIX.  DIA is the DJIA, SPY is the S&P500, MDY is the S&PMidCap400, IWM is the Russell2000, ICF is the Cohen&Steers REIT index.  The rest are sectors stripped out of the S&P500; XLF is financials (other great financial ETFs include KBE, KRE, IAT, IHF, KBWR, QABA, and PSCF), XLV is healthcare (other great healthcare ETFs include IHE, IHI, XPH, IBB, XBI, and GNRX), XLY is consumer discretionary, XLP is consumer staples, XLI is industrials, XLE is energy, XLB is basic materials, and XLU is utilities.  The past performance speaks for itself, and is more reason to like the S&PMidCap400 (matched by MDY and IJH). ITA is a DJ Select Aerospace & Defense Index ETF.  In fixed income, EMB (similar to PCY) is the J.P.M. EMBI (the JPM Emerging Market Bond Index). FNMIX is the Fidelity New Market Income Fund, run by John Carlson (created in May 4, 1993) who used to try to match the performance of the EMBI, but in more recent years has included other types of fixed income in his fund.  Other tickers matching great fixed income indices include tickers HYG, JNK, SHYG, and SJNK.

The performance speaks for itself.


12.31.16-3.31.17 Barrons Indices.png
YTD performance of S&P500, S&PMidCap400, Russell2000, DJIA, and the Nasdaq100.


To me I’d say that the S&PMidCap400 (IJH) is likely to do great going forward, as is the JPM EMBI (tickers EMB & PCY).  REITs, after doing “relatively nothing” for the past two or more years (see tickers ICF and IYR… and OLD a hospital REIT ETF) are likely to do well going forward, as will the rest of financials, I like tickers KRE and KBWR best.  Healthcare has also been hurting over the past year or two, I’d imagine it will do great going forward (see tickers XLV, XPH, IHI, and IBB).  The sectors I’d focus on include financials, REITs, and healthcare; in addition to the broad based S&PMidCap400 index.  The U.S. broad based indices are roughly -1.90% to -2.50% percent off their all time highs(!!!); So it may be time for a party, Miley Cyrus – “Party In The USA.”

Many have been amazed by the performance of the stock indices since roughly November 4, 2016 (or as the media likes to say, since the election of Nov. 8th).  The liberal media would have wanted you to believe that if Trump won, the markets would immediately collapse by over -50.00%, and WWIII would have begun, but they were wrong.  I think the markets wanted to run up, regardless of who won the election.  The indices hadn’t really registered any gains from roughly November of 2014 through early November of 2016, so it was time for a rally.  I think financials have a long way to go to regain some of their mess since what I describe as “the greater depression” (of late 2007 through early 2009). I would also say that healthcare has great potential after the mess of the past 12 to 24 months.  Given that financials and healthcare are two huge sectors of the economy and of the markets, I’d say that prospects for higher stock prices are very good going forward over the next 6 to 18 months, if not further.  The labor markets are strong, housing prices are strong and strengthening, and corporate profits are increasing.  Consumer spending and consumer sentiment are great right now.  Additionally, growth is picking up not only at home, but worldwide as well.  There is the possibility of deregulation as well of e.g. the U.S. financial sector, which could provide higher growth rates (with the elimination of e.g. Dodd-Frank, the Durbin Amendment, and Sarbanes-Oxley).  I will reiterate everything I said in my last blog post regarding current risks, click here for that list of risks.

I think the only thing that will derail the U.S. economy and its markets will be an aggressive Fed that raises rates too much too quickly.  This will contract the credit markets, and put pressure on consumer spending.  Everyone is good at sloshing around borrowed money from themselves to each other.  When everyone stops spending (as consumers are the biggest part of GDP and GDP growth), a recession and bear market will come.  Jobs will be lost, income will decline, earnings and revenue will decline, housing prices will decline, and mortgages and auto loans will be put under pressure (nonperforming loans will increase). So be careful, because things are quite rosy right now (and could take a turn for the worse).  I think it will take at least a year (to 24 months) for this possibility to materialize, as rates are still quite low right now.

Once the Fed realizes it has destroyed economic growth and the economy, and the markets, it will then begin to reduce interest rates, in an effort to stimulate the wrecked economy and the markets (there are numerous examples of this in the past).  I can’t understand why they can’t just leave interest rates “lower for longer,” as many like to say. What’s wrong with zero interest rates? After all most people (and the government) are net borrowers, not lenders, so low rates benefit everyone.

Abroad central banks have gotten so ignorant they’ve moved to negative interest rates! Negative interest rates probably should cause a total default.  Who would buy a bond, lending money to someone (even to a central bank), and then owe (as a lender aka a creditor) the borrower more money (the negative interest rate).  What happened to the time value of money?!  Negative interest rates make absolutely no sense.  Negative interest rates sounds like something Bernie Madoff came up with!

If you’re looking to take some risks in the financial markets abroad, I’d say to checkout and keep an eye on tickers AFK, FM, EZA, EGPT, ILF, EWZ, EWW, EWM, EPI, FXI, GREK, ASHR, ASHS, VNM, RSX, and TURThese (tickers) securities are subject to great risks, including expropriation of assets, as some foreign governments are totally corrupt!  So be careful!  Brazil (ticker EWZ) is coming off of 10 years of a worsening terrible recession, the worst in 30 years in Brazil. I believe it’s rebound time for Brazil. The Frontier Markets (ticker FM) of Africa has a bright future (as does ticker AFK also).  Egypt (ticker EGPT) just had a nasty correction, and appears to be recovering more recently.  Russia (RSX) and Brazil (EWZ), which are very oil intensive, have come off of terrible recessions due to low oil prices, which in the last 12 months have increased to $50.85 (but are still well below the $133 per barrel of roughly 2008). China (tickers FXI, ASHR, and ASHS) and India (ticker EPI) have great prospects over the long run.  China’s bubble deflated last year and is recovering. Vietnam (ticker VNM) is embracing capitalism and is becoming very successful, more so every day.  Russia (like Brazil) has been benefiting from a rebound in oil prices over the past 12 to 18 months, I expect Russia to continue to do well going forward. Turkey (ticker TUR) has been recovering over the past 12 months after its most recent economic and political mess.  Mexico (ticker EWW) is looking up, as anti-NAFTA types aren’t gaining any leverage in Washington (besides free trade is great for all participants).  Greece (ticker GREK) is a basket-case but appears to be getting better.  Definitely beware of emerging market (and all foreign) equity funds (they are not in any way like the JPM Emerging Market Bond Index), as they are notorious for enormous and spectacular declines and terrible recessions which wreck their equity markets.

Personally, I wouldn’t even invest in e.g. Germany, the U.K., France, or Japan, they’re plagued with great demographic messes (like the USA), thanks to birth control pills, which has wrecked the possibility of high economic growth, and has buried us all (us all being the 1st world) under a mountain of debt.  The developed 1st world abroad is notorious for trading at a discount on a PE Multiple basis to the USA; this is because there is little prospects for growth in most of western europe. So avoid europe. The birth rate and fertility rate have fallen off a cliff due to “the pill” and is the primary reason we’re all in debt up to our eyeballs in the 1st world (USA included).  Everyone having no children means no growth, no demand for anything (deflationary forces), and is a major stressor for generous entitlement programs like Social Security, Medicare, and Medicaid- which are a direct transfer from “the working” to “the retired” (and “the working” have been eliminated prior to birth, thanks to the pill). People like Tom Brokaw say they’re part of The Greatest Generation, but maybe they’re responsible for the total idiocy of not only nuclear weapons, but also of the total idiocy of birth control pills, which ushered in a new era of total genocide of developed nations (aka the 1st world).  There could be total defaults thanks to birth control pills placing unprecedented stresses on the generous entitlement programs of the developed (1st) world.  This may be one good reason why emerging markets have better prospects going forward, as they’ve not participated in the total genocide of the pill since the 1960’s, and some do not have generous entitlement programs.

Here are some great resources (the dirty dozen) I like to use to judge where the economy & markets are heading:

  1. The Economic Indicators,
  2. The Fed’s Statement & The Fed’s Projection Materials,
  3. JPM Asset Management “The Guide to the Markets,”
  4. Kiplinger’s Economic Outlook,
  5. FRED Unemployment Rate,
  6. FRED Corporate Profits before Tax,
  7. FRED TED Spread,
  8. Atlanta Fed GDP Now,
  9. Fidelity’s Business Cycle AnalysisFidelity’s Most Recent Report,
  10. CNN’s Fear & Greed Index,
  11. CNBC Rapid Update,
  12. Wall St. Journal’s Economic Estimates.

Happy Trading!,

Andrew G. Bernhardt

[Great Investing Links]  [Great Investing News Links]  [My Google+ Page, where I feature articles that caught my eye]