SATURDAY, DECEMBER 31, 2016
MARKET & ECONOMY CHECKUP

The year 2016 came and went faster than seemingly any other. 2016 started off with a nasty sell off, the worst start ever for the beginning of any year for the stock market. The sell off lasted through January 20th, and retested the lows about a month later, around February 11th. The year then went on to rally strongly, finishing up by double-digits (but with some hiccups along the way), despite unusually low GDP growth. Most of the gain coming from roughly November 4th to the present (and the peak of roughly June of 2015 was not exceeded until roughly November 15, 2016, with a big interim drop-0ff in between).

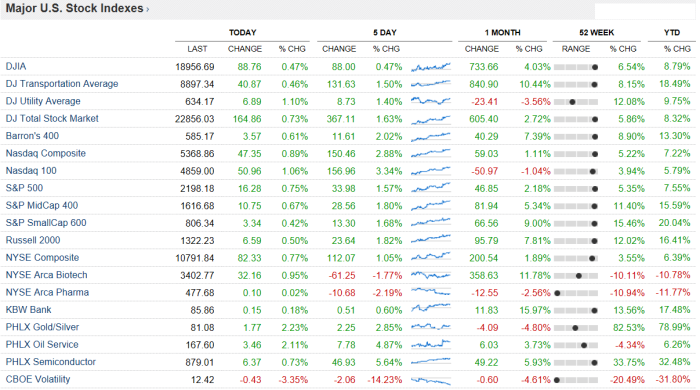
As you can see it was a great year for equities and fixed income alike! I’ve always said (for equities) I like the S&PMidCap400 (matched by tickers IJH and MDY) best because it has companies with market capitalizations of $2 to $14 billion dollars, which have significantly more consistent EPS growth, and also higher EPS growth rates than their large capitalization counterparts (in e.g. the S&P500, where the market caps are from $14 billion to $622 billion [AAPL’s current market cap]). Higher and more consistent growth of earnings is what makes stocks appreciate faster. In other words, it is more difficult for enormous large-cap companies to grow at the rates of mid-caps. In 2016, the S&PMidCap400 returned +18.73%, while the S&P500 (aka the S&PLargeCap500), matched by ticker SPY) returned +9.54%. That’s a huge difference!!! I’d expect that mid-caps will continue to outperform large-caps over the long run (over most, if not all 1, 3, 5, 7, 10, 15, and 20, etc. year periods). Additionally, there just isn’t much hyped up baloney galore components in the S&PMidCap400 when compared to the S&P500.
It should be noted also that the S&P500 has a heavy weighting on the hyped up tech sector (with nose bleed PE Multiples), while the S&PMidCap400 does not; and this led to a total outperformance of mid-caps through the recession and market mess of 2000 through 2002 (see the diagram below). Here we are in 2017 now, and the Nasdaq-100 has just very recently exceeded the value it first reached in March of the year 2000 (yes, it has really been nearly 17 years!). Obviously, if you adjust the Nasdaq Composite’s old all time high of March 10, 2000 of 5,134 (and the Nasdaq-100’s peak in March of 2000) for inflation and for currency depreciation, then it’s still not anywhere near where it was nearly seventeen years ago! I like to say tech is a four letter word and I seriously hope I never buy another hyped up tech stock again. In 2016 the Nasdaq-100 (matched by ticker QQQ) returned +5.89%.


Additionally, I’ve always said (for fixed income) that I like the J.P. Morgan Emerging Market Bond Index best (the JPM EMBI), matched by ticker EMB, which had a total return of +9.41% in 2016. I’ve always said that if the JPM EMBI is good enough for the Harvard Endowment Fund it’s good enough for me and you! I strongly believe that all fixed income should be replaced with ticker EMB (and/or ticker PCY, a very similar index).
In the sector of High Yield U.S. Corporate fixed income (matched by ticker HYG) returned in 2016 an outstanding +13.91% (similar ETFs include JNK, SJNK, and SHYG which returned +12.29% in 2016).
REITs retuned +4.57% in 2016 as measured by the Cohen & Steers Realty Majors Index (matched by ticker ICF).
Personally, I like the Hospital and Long Term Care Facility REITs best; See ticker OLD (by Janus) and its components (the fund began trading in June 8, 2016). Prison REITs (tickers GEO and CXW) also have great yields.
Mortgage Asset Backed REITs (see ticker REM and its components) have also done very well and is +21.95% in 2016. Many of the components of REM have great dividend yields [click here for quotes on ETF ticker REM’s and its components].
Some of my favorite REIT tickers would include: HCN, HCP, OHI, NHI, SBRA, CCP, VTR, MPW, DOC, SNH, GEO, CXW, GOV, and DEA [click here for quotes on these tickers].

January’s sell off was blamed (in retrospect) on worries on China’s actual (or legitimate) growth rate, the strong dollar (and weak foreign currencies), and whether or not a recession would materialize (since the current economic boom is and was “long in the tooth”) in the USA and elsewhere. Additionally, early 2016 saw light sweet crude oil fall into the $20s per barrel, which made everyone nervous about possible looming bankruptcies in the energy sector, which did not materialize (despite the energy sector’s very very light weighting in the U.S. broad based indices). People apparently think the USA is similar to Kuwait, Saudi Arabia, Russia, and Brazil. The USA’s economy is a little bit more diversified than those energy-centric nations. The snap-back in oil prices (closing out 2016 at $53.89 per barrel) led to a strong recovery in the energy sector, and in the economies and stock indices in Brazil [see ticker EWZ, +63.86% in 2016, and ticker EWZS +64.78% in 2016] and Russia [see ticker RSX, +47.10% in 2016, and ticker RSXJ +103.50% in 2016]. For U.S. energy sector exposure, checkout tickers XLE and PSCE. And as Janet Yellen has said- Economic booms don’t die of old age. Perhaps we’re going to see the longest economic boom in the history of the United States (which isn’t really saying much because the USA is only 240 years old!).
So, 2016 had a mini-panic and sharp sell off in January, lasting through about February 11th. The broad based stock indices then rallied until roughly the BrExit Referendum of June 23rd. Shockingly, the U.K. voted to leave the Euro Union (sparking or pointing out a seemingly worldwide sense of nationalism and protectionism), setting off a sharp and quick global sell off, lasting just two days until roughly June 27th. The markets then rallied back sharply, and then traded sideways until roughly November 4th, when the markets began a very rapid ascent! The majority of the return in equities (since roughly December of 2014 through March of 2015) has materialized from roughly November 4th to the present!!! In other words, the DJIA reached 18,000 in December of 2014, and it was there again in November of 2016, before kissing 18k good bye. And no one said the markets would rally on a Trump victory! The consensus was wrong again. Today, DJIA 20k (and higher) seems within reach.
I believe the markets have rallied so strongly since the Trump victory because of hopes of repealing Obamacare (aka the Affordable Care Act, which everyone knows isn’t at all in the slightest way affordable, and even Bill Clinton calls it “the craziest thing in the world”). They’re hoping for change regarding banking regulations (which turned our nation’s best financial institutions into “zombie banks” since 2008); The people (whether or not they know it) want Dodd-Frank and the Durban Amendment and the Volcker Rule repealed and trashed. They also want tax reform, and a repatriation of foreign earned income currently kept abroad by our nation’s largest companies because of horrendous tax rates in the USA. If these reforms can really take place, then the markets could really rally some more! If in the first 100 days of the Trump Administration, if none of these reforms materialize, then the markets could be in for a major reality check, and could easily come back down (especially financials which have rallied very strongly since November 4th, see tickers XLF, KBE, and KRE).
Luckily, there doesn’t seem to be any bubbles really anywhere currently, except in some foreign markets, in the value of Bitcoin (ticker GBTC… a “crypto-currency;” Likely not worth even the value of Parker Bros. Monopoly money), and select healthcare (predominately in some Biotech, which has now been selling off since roughly 7-20-2015), and select tech (e.g. the PE Multiples of the following tickers: NFLX 334.65, FB 55.00, AMZN 171.79, GOOGL 29.00 – Foolishness and rip off comes to mind with these valuations!). Who would buy any stock with a PE Multiple in excess of 300?! Worse still, who would buy the stock of a company with zero (or negative) earnings, like Tesla (ticker TSLA), which loses more and more money with each and every vehicle sold?! Bitcoin is total nonsense, and investors would likely be much better off investing in trash, literally! Checkout tickers WM, WCN, RSG, and CVA, which are what I call “The Four Kings of Trash.” I’ve heard talking heads on CNBC trying to rationalize Bitcoin, saying it is a medium of exchange for e.g. the people of Venezuela and other corrupt locales on Earth. I would disagree, as they can barter with something of actual value, or they can use the Euro, the British Pound Sterling, or the U.S. Dollar, etc. An actual piece of currency or money, includes a store of value, a medium of exchange, and a unit of account, backed by the full faith and credit of a central bank and its people (not electronic nonsense!). Bitcoin is pure foolishness and nonsense. I would estimate that the Bitcoin bubble will burst in 2017, see ticker GBTC; Bitcoin is the epitome of Extraordinary Popular Delusions and the Madness of Crowds, and I believe it is a rage and a mania that will end in (tears and in) a panic crash. I’m surprised The Greater Fool Theory has kept its value up this high and for this long.

As you can see above, the current PE Multiples are as follows: DJIA 21.56, DJ Transports 16.37, DJ Utilities 27.93, Russell2000 nil [reported as 21.73 at the iShares website for ticker IWM], Nasdaq100 24.22, and the S&P500 24.82.
As reported at iShares the S&PMidCap400 has a PE Multiple of 23.18 (see the iShares website for ticker IJH).
I would encourage all of you to visit the Powershares website, iShares website, and SPDR websites for all kinds of great info on your favorite ETFs.
I believe that 2017 (if not into early to mid 2018, at least) will see the economy grow modestly (at around 2.3% to 2.8% GDP growth), slightly stronger than 2016 worldwide, with no materialization of any recession in the USA. I would estimate that inflation will remain below the historical average of +3.88% for many more years, which should help to keep interest rates lower for longer (but I expect interest rates to increase all along the yield curve for all credit qualities, especially in the higher credits). I would estimate that King Dollar will continue to strengthen. And I would estimate that real estate in the USA will continue to appreciate at roughly the historical norms. I also would estimate that light sweet crude oil will continue to appreciate, perhaps to $75 per barrel over the next 18 to 24 months (it did peak at roughly $145 per barrel in 2008; This bodes well for Russia, Brazil, Venezuela, and the Middle East). Of course there could be mini-panics (similar to January and February of 2016) about China’s growth rate, King Dollar’s strength, weakness in Asia & the emerging markets, earnings (and GDP) growth at home and abroad, the ramifications of Trump’s tax reforms and other policies, and other political risks, and of course fear of a looming recession. There could also be a looming banking crisis in Europe, centered in Italy, where there are too many non-performing loans for their financial sector to absorb. Investors can get spooked easily. Losses from the stock market in a panic could have a negative-wealth-effect which could hypothetically make people spend less, and when they do, companies will earn less, leading to layoffs (higher unemployment), and ultimately to a recession. The best thing to do, is to (try to) buy on the dips, and not panic. The U.S. economy is resilient, and most bounce-backs begin 18 to 24 months off of all time highs (when bear markets [at depths of -25 to -35 percent off stock market peaks] and after recessions have materialized). The most bullish anyone should ever be, I believe, is when the front page of the Wall Street Journal says something like “It’s Official there’s a Recession in the USA.” Many in the past have said that we should all strive to “buy when there’s blood in the streets,” meaning buy on the dips. To me, this means that investors should rotate out of fixed income and into equities once a recession has wreaked havoc on the markets for 18 to 24 months, in the magnitude of -25% to -35% off the all time highs (or they can buy on margin, or they can buy e.g. deep in the money call options on the S&P500 using expirations three years away). The idea is to increase risk and market exposure at the depths of the madness of recessions.
I believe that 2017 will see a rebound in the healthcare sector’s equities. See tickers XLV, IHE (IHI and IHF), XPH, IBB, GNRX, SBIO, and CNCR (some of these are significantly more risky than others, so swim at your own risk!). It’s time, I believe, for a rebound in healthcare stocks, as many of them have been in decline now for 18 to 24 months. If I hand picked two I’d say take a look at Allergan PLC and Glaxo Smith Kline PLC, tickers AGN and GSK. After all, Hillary Clinton, Bernie Sanders, and Elizabeth Warren (and the entire democrat party) will not be condemning the healthcare sector any more, as the election is over! And I have the feeling that if there is a widespread overhaul of the healthcare system, if and when the republicans repeal the Affordable Care Act, I believe that the healthcare sector will emerge from the changes stronger than ever! The congress may act hysterical and upset about the healthcare sector and its profits, with its executive pay of its CEOs, and with the cost of drugs at the pharmacy, but in the end, I don’t really see them changing much (due to “bureaucratic resistance”), and there will not be price controls in the USA.
I will leave you with the ten DJIA stocks with the highest yields, otherwise known as “the Dogs of the Dow,” (which has historically outperformed the DJIA for many years). Ticker & Yield: VZ 4.34%, PFE 3.94%, CVX 3.67%, BA 3.65%, CSCO 3.44%, IBM 3.37%, KO 3.37%, XOM 3.32%, CAT 3.32%, and MRK 3.20%. Additionally, the “Puppy Dogs of the Dow,” (also referred to as “the Small Dogs of the Dow”) has also consistently outperformed the “Dogs of the Dow,” and includes the five lowest price stocks out of the ten “Dogs of the Dow,” being MRK, KO, CSCO, PFE, and VZ. For more information on the “Dogs of the Dow” and on “the Puppy Dogs of the Dow” visit DogsOfTheDow.com [click here].
The following resources can assist you in judging the strength of the economy and the direction it’s moving in (click the blue text to go to the link)…
- The Economic Indicators,
- JPM Asset Management’s “The Guide to The Markets”,
- Minutes of the FOMC,
- The U.S. Treasury’s “Debt to the Penny”,
- Atlanta Fed’s GDP Now,
- Kiplinger’s Economic Outlooks,
- FRED’s Corporate Profits Before Tax,
- FRED’s TED Spread, and
- FRED’s Capacity Utilization.
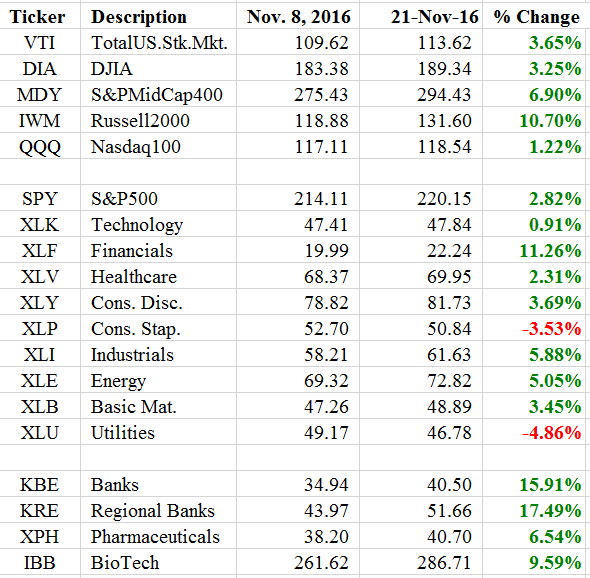
UPDATE: As of 1-9-2017 the SPDR Family of ETF Funds has finally released their official 2016 performance figures; So I’ve made a table of those figures below. I have also included the sector allocation of these tickers in the S&P500 (matched by ETF ticker SPY).

Happy Trading,
Andrew G. Bernhardt
[Click here to go to my Great Financial & Investing Links Blog Page]