Sunday, February 22, 2015
“WEEKEND UPDATE- NEW HIGHS FOR STOCKS AT BROAD & WALL”
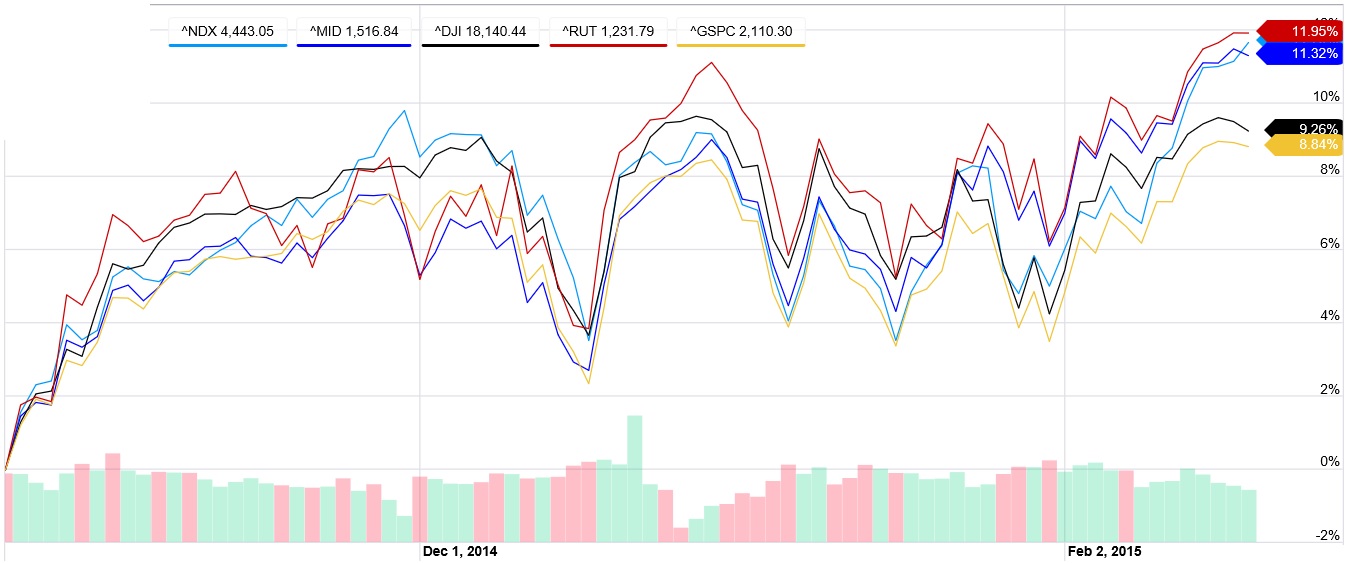
MORE GAINS FOR WALL STREET. Friday saw most major U.S. stock indices increase, bringing the major market averages into positive territory for the week, thanks to compromise midday on Greece and a German Bailout. For the week, the DJIA gained +0.67%, the S&P500 gained +0.63%, and the S&PMidCap400 gained +0.94%. The indices now stand roughly 1.78 to 4.80 percent in the green YTD; The Nasdaq Composite and Nasdaq 100 indices are getting within roughly 2.78% of highs reached on March 10, 2000, yes really, just 15 years ago! If the Nasdaq can rise by +2.78% they’ll break even with where they were 15 years ago (before inflation and currency depreciation adjustments of course over the past 15 years). On Friday, volatility, as measured by the VIX imploded by -0.99 points or -6.47% to 14.30. See the graphic below for daily and weekly performance of the U.S. Major Stock Indices. In fixed income Friday, Treasuries and High Yield Sovereigns traded higher by +0.20% to +0.40%. See the graphic below to see how fixed income faired. I continue to believe the major U.S. stock indices will increase slightly by 2 to 3 percent before taking a few steps back, before making another advance to new all time highs. I continue to remain bullish, and I believe energy shares and crude oil will trade in a volatile range, but will trade higher given a month or two or more, which I believe will lift all major U.S. Stock Indices to new highs. Lastly, I think that higher energy prices will bring “hot” (meaning higher than usual) CPI-U monthly figures, which will put upward pressure on fixed income yields in the open market, particularly in the Treasury long term and intermediate maturity sectors. I am however expecting the next CPI report to come in negative with deflation for the month. The average monthly CPI monthly increase has been approximately +0.20%; Since oil’s “demise” it’s been quite low, closer to zero, if not negative month to month. As energy prices (primarily light sweet crude oil) rebounds, I’d expect the monthly CPI-U figures to come in “hot” at nearly twice to three times the historical average, at literally +0.4% to +0.6% month to month for a while. Treasuries are coming off prices of nearly unprecedented highs, due to unprecedented low yields; RATES ARE RISING, and fast. Thirty year zeros (as measured by etf ZROZ) are down by -13.33% off their all time highs, which I believe they’ll never see again, or at least, for many many years. Conventional thirty year Treasury bonds (as measured by etf TLT) are down by -8.64% off of their peak. Long term (and intermediate) Treasury yields have no where to go but upwards, which will bring Treasury prices down further, due to higher yields. High yield fixed income yields are not at unprecedented low yields, and therefore, may not sell off as strongly as Treasuries, given equal maturities. Higher or “hot” CPI-U monthly figures could also put pressure on the FOMC to raise rates, perhaps as early as this summer. Given the slowdown in Europe, Greece, and in China however, this rate increase program of the FOMC may be delayed, past this summer. Initially, I believed rate increases would not materialize in 2015, then I believed perhaps the Federal Reserve would raise rates in June of 2015, I’m beginning to believe that perhaps the rate hikes will be delayed past June 2015, maybe in September or in 2016 they will raise rates. The earliest rates would be increased would be summer (June) of 2015 I believe. Higher yields at the short end (raised by the Federal Reserve) are likely to push rates up across the board. I wouldn’t be surprised if long term Treasury Securities saw negative total returns over the next 36 months. I believe, long term maturity Treasury bond investors (and perhaps intermediate Treasury note investors) are in for a big surprise(!!!), called negative total returns over the next three years, as rates begin to “normalize” in the USA. I believe investors will be totally shocked at how much can be lost in a Treasury bond as rates increase. If rates rise by 200 basis points at the long end, there could literally be 30% losses for Treasury bond investors. Additionally, there could be nearly literally 60% losses for 30 year Zeroes in the Treasury Bond market. Interest rate risk is measured by duration. Swim at your own risk!
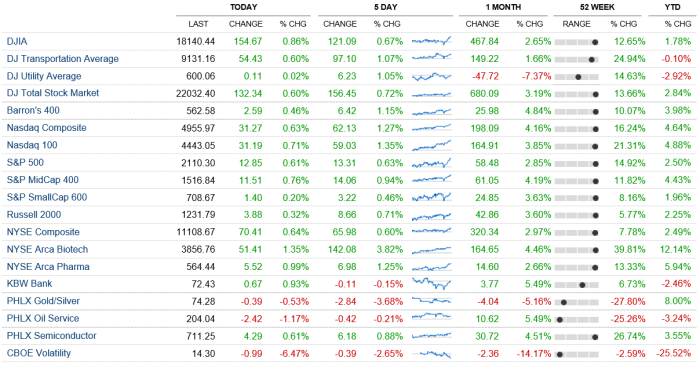
Feb. 20, 2015, Major U.S. Stock Indices
[http://finance.yahoo.com/futures Click here for an energy prices update] Friday saw USO an etf of West Texas Intermediate decrease by -2.36% to 18.65; USO is now -52.71% off its peak of the past 12 months; reached in late June ’14; USO is also +14.42% off rock bottom, set on January 29th at 16.68. I believe oil will remain very volatile, perhaps an options strategy called an at-the-money straddle using two week out expirations could prove to be very lucrative; I believe oil is going a lot higher (maybe another 10% or more), and soon (over the next few weeks). I would base this estimate of mine on the oil-VIX which is extremely high right now. If the oil-VIX implodes, it will bring higher oil prices. On Friday light sweet crude oil traded lower by -1.97% or -1.02 per barrel to $50.81. Volatile oil is making the Russian stock market (as measured by the etf RSX) very volatile. [Click here for an Oil-VIX chart & update]
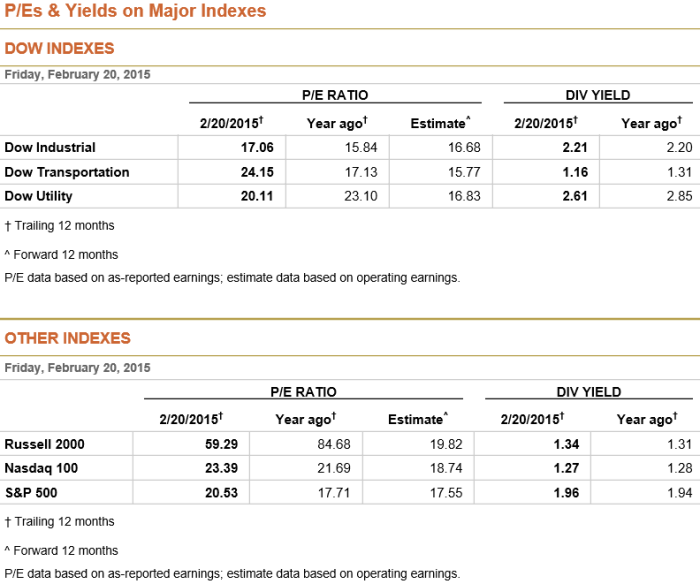
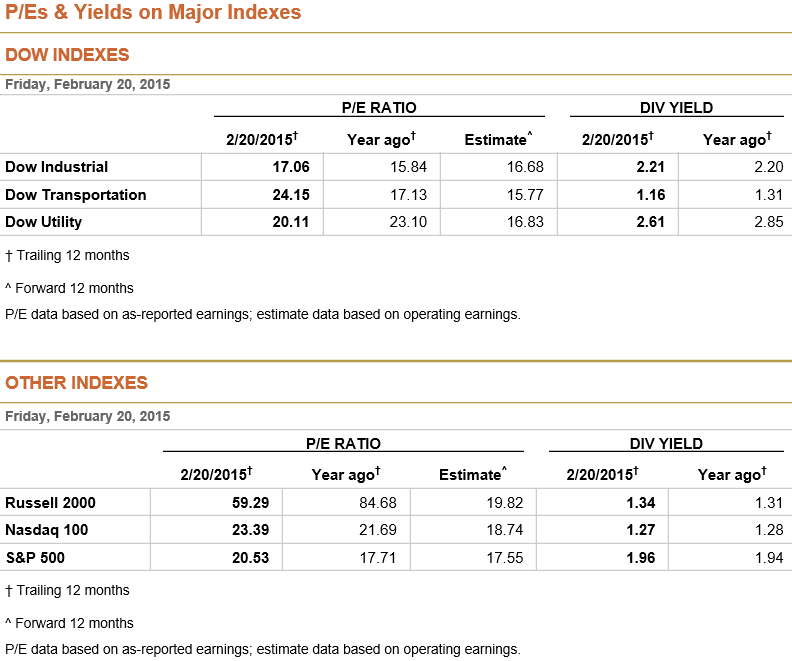
PE Multiples & Yields of Major U.S. Stock Indices, Feb. 20, 2015
As you can see the PE Multiple of the DJIA is lower than other major U.S. Stock Indices; The dividend yield of the DJIA is 2.21%, and it was 2.20% last year. The 30 year Treasury bond yield is 2.73%,and the ten year Treasury note yield is 2.13%. Therefore, with such high dividend yields on equity indices it’s difficult to be bearish and I believe the stock market has some potential to move higher. [Click here for Yields on Treasury Securities, http://finance.yahoo.com/quotes/^IRX,^FVX,^TNX,^TYX]
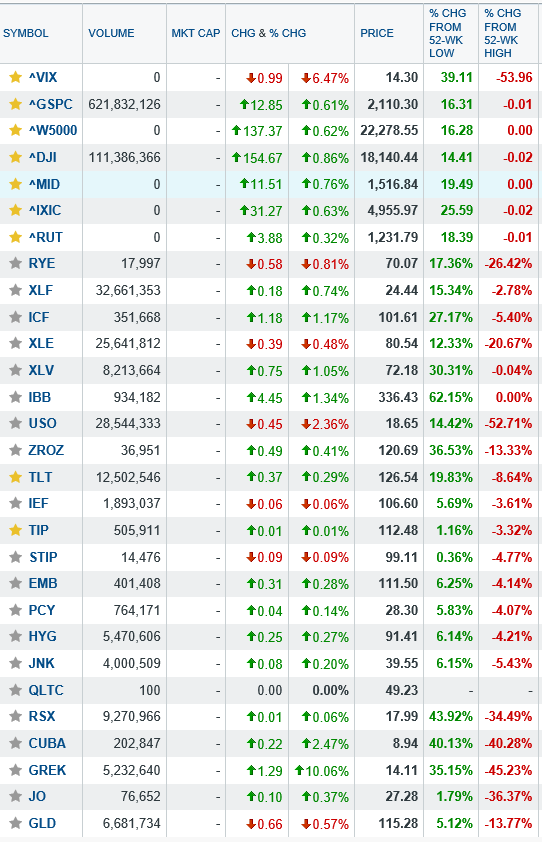
Select Quotes of Interest, Feb. 20, 2015
In the Fixed income markets, see the graphic above to see how Treasury etfs traded (ZROZ, TLT, IEF, TIP, STIP) and how high yield etfs traded (U.S. dollar denominated high yield sovereigns being etfs EMB and PCY) (as well as high yield corporate fixed income being etfs HYG, JNK, and QLTC). The 30 year Treasury Bond yield closed at 2.73%, and the 10 year Treasury Note yield closed at 2.13% [Data from here: http://www.treasury.gov/resource-center/data-chart-center/interest-rates/Pages/TextView.aspx?data=yield%5D. I continue to believe, and will reiterate, that if oil can stabilize in a trading range, or start to appreciate, that there will be some major opportunities in the energy sector in equities, and in their high yield fixed income; Also I continue to believe that when oil stabilizes (or begins to appreciate) that there will be some major opportunities in high yield fixed income funds, such as the ones listed above, EMB, PCY, HYG, JNK, and QLTC. When higher energy prices materialize in the future, inflation could pick up as measured by the CPI-U, which may or could send e.g. Treasury Security yields higher, while also pressuring the FOMC to raise rates at the short end.
Friday saw the US Dollar trade slightly lower versus the Ruble, but slightly higher versus the Euro; The Euro gained approximately +0.13%, as measured by the etf FXE. I continue to believe the Ruble and the Euro are still too high, and will further deteriorate, making the dollar stronger. The U.S. Dollar can now be exchanged for a Euro at a cost of approximately $1.1384, and also can now be exchanged for 61.8745 Rubles. [http://finance.yahoo.com/currency-investing Click here for an update on all major cross rates.]
I believe the catalysts for today’s and this week’s stock market increase were Greece and its debt negotiations with the Euro Zone and with Germany, as settlement talks came to a positive note on Friday, the market took off; Consequently, on Friday, an etf of Greek stocks (etf ticker GREK) increased by +10.06% to 14.11. The etf GREK has been on a tear lately!
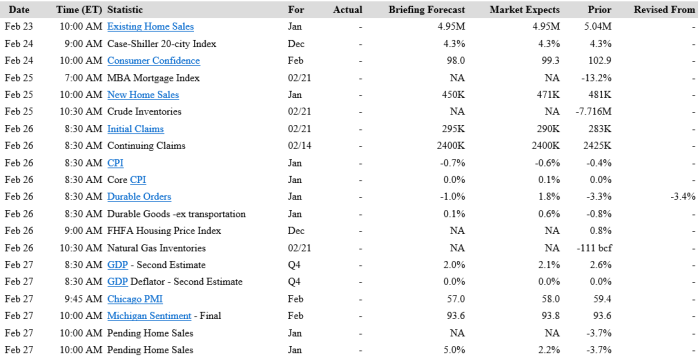
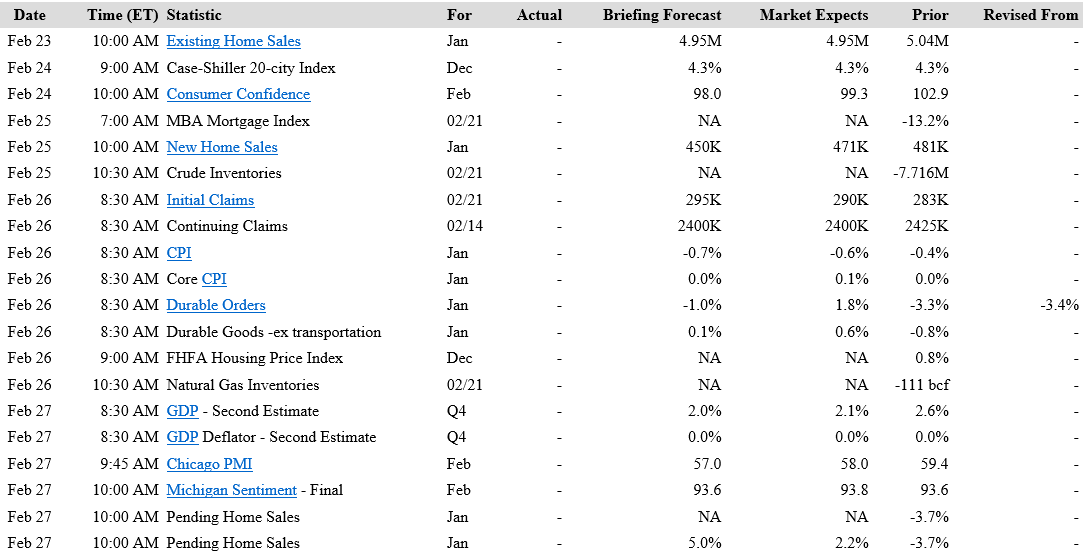
Above is a summary graphic of the weeks scheduled economic data releases.
[Click here for updates on Futures vs. Fair value, http://www.cnbc.com/id/17689937].
On the 25th, after the close, Transocean, ticker RIG reports eps; Shares have gone from roughly 43.14 to 17.01 in the past 12 months (they have also recently announced a major cut to their dividend). I believe the stock could move up or down by 1.50 per share immediately after its eps report. Perhaps its time for RIG to stop declining, and to begin a new bull run?
I would suggest that perhaps a long bull call ratio back spread with net credit characteristics may be lucrative; Especially if also combined with a long bear put ratio back spread with net credit characteristics on any particular “hype stock” just before eps are released; Placing the trade just a minute or two before the close (3:00PM Central Time) on its earnings release date (if it reports that day after the close, or the next morning before the opening bell). It certainly is amusing to see what happens to hype stocks just after their eps releases in the aftermarkets and on the first full day of trading post eps. Most sink fast!
“Hype stocks” to me would be e.g. GOOGL, TSLA, PCLN, P, FB, AAPL, LNKD, AMZN, EBAY, NFLX, TWTR, BABA, GPRO, and Z, and also what I would describe as “Big Momentum Players” such as e.g. CMG, GMCR, AZO, V, and MA etc. (a sub group of hype to me). This list of Hype and Big Momentum Players is just off the top of my head, and is in no particular order, nor is it any particular science for choosing these types of volatile securities. RSX, GREK, PGAL, EWI, EIRL, EWP, TUR, FXI, EWZ, and CUBA are also very volatile etfs found in places worldwide with high geopolitical risks. West Texas Intermediate matched by the etf USO is also a very volatile etf to trade as of late.
I will continue to reiterate that I’m currently bullish on the major U.S. stock indices. I believe a theme of higher crude oil prices will potentially materialize over the next few weeks, if not becoming more of a longer term theme, for the next year, if not longer. I also believe that Greece has bought itself another 4 to 6 months (starting Feb. 20th) before anyone has to really worry about its ability to repay interest and principal on its debt. Also, if Russia ever stops sabre rattling that would be the next catalyst for the markets to move higher. If oil moves higher I believe that will bode well for energy sector shares, and for the stock indices in general, bring about higher prices still. I also think that investors may begin selling longer duration and longer maturity fixed income of all kinds, and with the proceeds they may purchase stocks, resulting in higher yields on fixed income, and also higher stock prices. Higher energy prices may bring about higher monthly CPI-U inflation figures, resulting in a fixed income sell off, and higher interest rates, over the next 6 to 12 months, if not for the next 36 months. Interestingly, I believe that the higher credit quality fixed income may sell off more than the lower credit quality fixed income. I would base this upon the unprecedented sovereign yields worldwide and in the USA. To me, this means that Treasuries at the long end, may suffer great losses as rates “normalize.” For 2015 I am most bullish on equities and the S&PMidCap400, the S&P500, as well as the DJIA. The DJIA has the lowest PE Multiple among all the major U.S. Indices currently. I am also bullish on Financials (including XLF), REITs (particularly Hospital REITs such as HCP, HCN, SBRA, OHI, NHI, and/or the etf ICF), and the “Big Tobacco” (e.g MO, PM, RAI, BTI, etc.) sectors; In fixed income I like high yield etfs e.g. EMB, PCY, JNK, HYG, and QLTC (it may be a great time to snatch up some CCC rated fixed income!). Options can be used to “hedge” fixed income ETFs as well, in strategies such as level one covered call writing (of e.g. at-the-money monthly calls). I believe the best thing to do is to trade long term deep in the money LEAPS calls on stock indices, combined with very high allocations to high yield fixed income (along the lines of 10 to 20 percent in index options, and the remainder 80 to 90 percent in high yield fixed income). If the JPM EMBI (matched by etf ticker: EMB) is good enough for high allocations of fixed income of the Yale and Harvard Endowment funds (and other large time institutional entities) then why trade Treasury Securities? I think people (or any entity) who buy Treasuries are “ripping themselves off!” Treasuries to me, generally speaking are for short term investing, and maximum preservation of capital. To me all fixed income with maturities over 10 years are extremely dangerous, the interest rate risk right now is very real even including Treasuries. The only type of Treasury I’d endorse right now is short term (0-5 years to maturity) inflation linked TIPs, via etf ticker STIP. All high yield fixed income indices (which are BB rated) have, over the long run, always closed at a new all time high every 18 rolling month period. Consequently, every or any time that high yield fixed income indices are trading well off their all time highs, I’d view it as a major buying opportunity! Happy Trading!
By Andrew G. Bernhardt


![[2-22-15] Backtesting Oct. 22 to Feb. 19, 2000-2015](https://bernhardtcapitalmanagement.wordpress.com/wp-content/uploads/2015/02/2-22-15-backtesting-oct-22-to-feb-19-2000-2015.png)