Multa abscondita lapidibus.
“Many Hidden Gemstones!”
The past two days has seen a surge in the prices of light sweet crude oil and also of brent crude oil. [Press here for a 6 month chart of oil]. As you can see, crude oil has depreciated from 101.33 dollars per barrel (reached on June 25, 2014) to the current 48.61. This is a drop in magnitude of -52.03%. Oil was substantially lower just a few trading days ago. It seems to have in retrospect, to have reached a low of 44.55 on Tuesday, January 13, 2015. So it’s rocketed +9.11% off of the rock bottom set on Tuesday. Despite this nearly 10 percent move, I think oil has a lot higher to go. Take a look at the oil volatility chart [Press here for 12 month chart of Oil’s VIX]. Tickers USO (-53.5% off its peak) and OIL (-57.28% off its peak) are etfs that match the performance of West Texas Intermediate Oil, and Brent Oil, and there are listed options on both of these etfs.
As you can see, there’s an inverse correlation noteworthy of significance between the trajectory of any particular volatility index, and the trajectory of the underlying security or commodity the specific volatility index is associated with. I think oil’s volatility has a lot further to fall, it may even implode, so that translates to “oil is going to move higher.”
If oil is going to move higher, then all energy related shares are going to (or may) move higher (see etf XLE which is still -25.90% off its peak). In addition to energy related shares moving higher, I think mostly all high yield bonds are going to move higher, as the energy sector has representation in high yield fixed income indices (see etfs HYG JNK QLTC). HYG is -6.14% from its peak, JNK is -7.63% off its peak, QLTC is -12.22% off its peak. I would also suggest or estimate that high yield sovereigns are going to rally, if oil can continue to hold its current value, or appreciate (see etfs EMB and PCY, both of which are U.S. Dollar denominated, despite being associated with foreign government high yield fixed income indices… this is because foreign governments sometimes borrow money in U.S. Dollars, and they pay interest in U.S. Dollars). EMB is -4.74% off its peak, and PCY is -3.83% off its peak. Lastly, the Russian Ruble and the Russian stock market (see etf RSX, currently -44.95% off its peak) may appreciate, in the short run, if oil can hold steady or appreciate. Many are worried about a Russian total default, so longer term, the coast is not clear, and the Russian economic (and political) storm continues. Russia is in the middle of a currency crisis, with the Ruble down nearly 50% over the past six to twelve months; Russian interest rates also seem to be surging. When will Russia’s war and/or hostile military actions against its neighbors end?
If Russia’s military hostility were to end, the stock and bond markets could really take off to the upside. I wonder when that day will come?
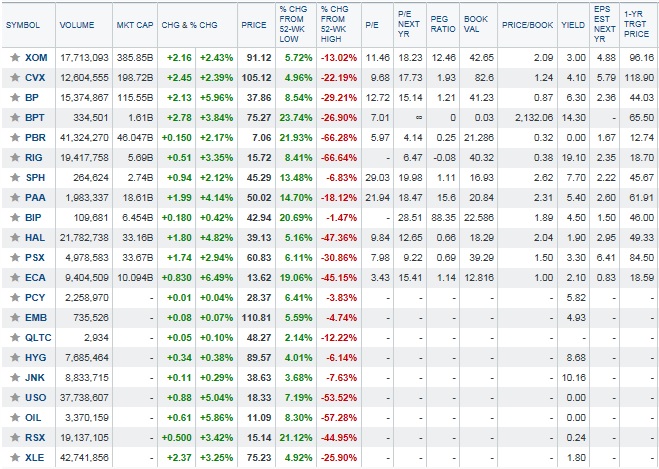
In the energy sector here are some Tickers I like to follow. I monitor the following tickers in the energy related sectors: XOM, CVX, BP, BPT, PBR, RIG, SPH, PAA, BIP, HAL, PSX, ECA.
Please keep in mind the energy sector is highly volatile, and may struggle for a while. Prices of oil have fallen so far and so fast that drilling projects are being shut, there have been layoffs, and their EPS and revenue will likely be terrible versus last year. The shoe-to-drop after that may be that management teams of energy related companies they may elect to cut their dividends, which would be a major catalyst for another wave of selling in the energy sector.
Options traders and investors that use options along with stocks, may really want to consider trading some married put (aka protective put) strategies in this space on XLE, individual energy sector stocks, and/or on e.g. USO. Other options traders may want to consider purchasing deep in the money calls on USO, with expirations of January 2017. If I was serious about amplifying USO I’d likely initiate a vertical bull call debit spread, by purchasing e.g. the 13 strike price calls, and then simultaneously selling the 26 strike price calls, using the January 2017 expiration (this strategy calls for being long the same number of contracts that you’ve written and are short). I’d also consider doing a diagonal bull call debit spread, which is very similar in strategy to the vertical bull call debit spread example above, only you write (aka short) a closer to front month, or a front week option against the long calls. I’d likely go long the same 13 strike price calls with the January 2017 expiration, and I’d then look to short (aka to write) closer to front week or front month calls against it, repeatedly, leading up to the January 2017 expiration.
[Click here for quotes on every ticker and ETF I mentioned in this Blog Post].
I hope you find the below graphic helpful in analyzing which stocks are well off of their peaks, and what their current dividends are. Again beware of the EPS reports looming for XOM, CVX, BP, and others scheduled for release in the next two to three weeks. XOM is scheduled to release its EPS report on February 2, 2015 before the opening bell; CVX is scheduled to release its EPS report on January 30, 2015 before the market open; and BP is scheduled to release its EPS report on February 3, 2015 before the opening bell.
[Press here to look up future EPS Release Dates by ticker symbol]
By Andrew G. Bernhardt